FrameFlow Report Elements Walkthrough 3: Inventory Reports
Learn all About FrameFlow Inventory Reports
FrameFlow's Inventory Reports
This blog post expands upon the mention of inventory reporting in our first reports blog post. Today, we'll focus on the different types of inventory reporting we offer: application, CPU, hardware, memory, service, and our latest addition, OS inventory reporting. Read on to learn a bit about each inventory table type and how you might use them.
Note: To change the type of any inventory report element, use the Actions menu to begin editing the element and change the setting called "Inventory Table Type", as seen in the GIF below. All types of inventory reporting are available in the dropdown list here and each report type divides your network devices into categories depending on the type of inventory reporting you choose.
 Setting the Type of Inventory Reporting
Application Inventory
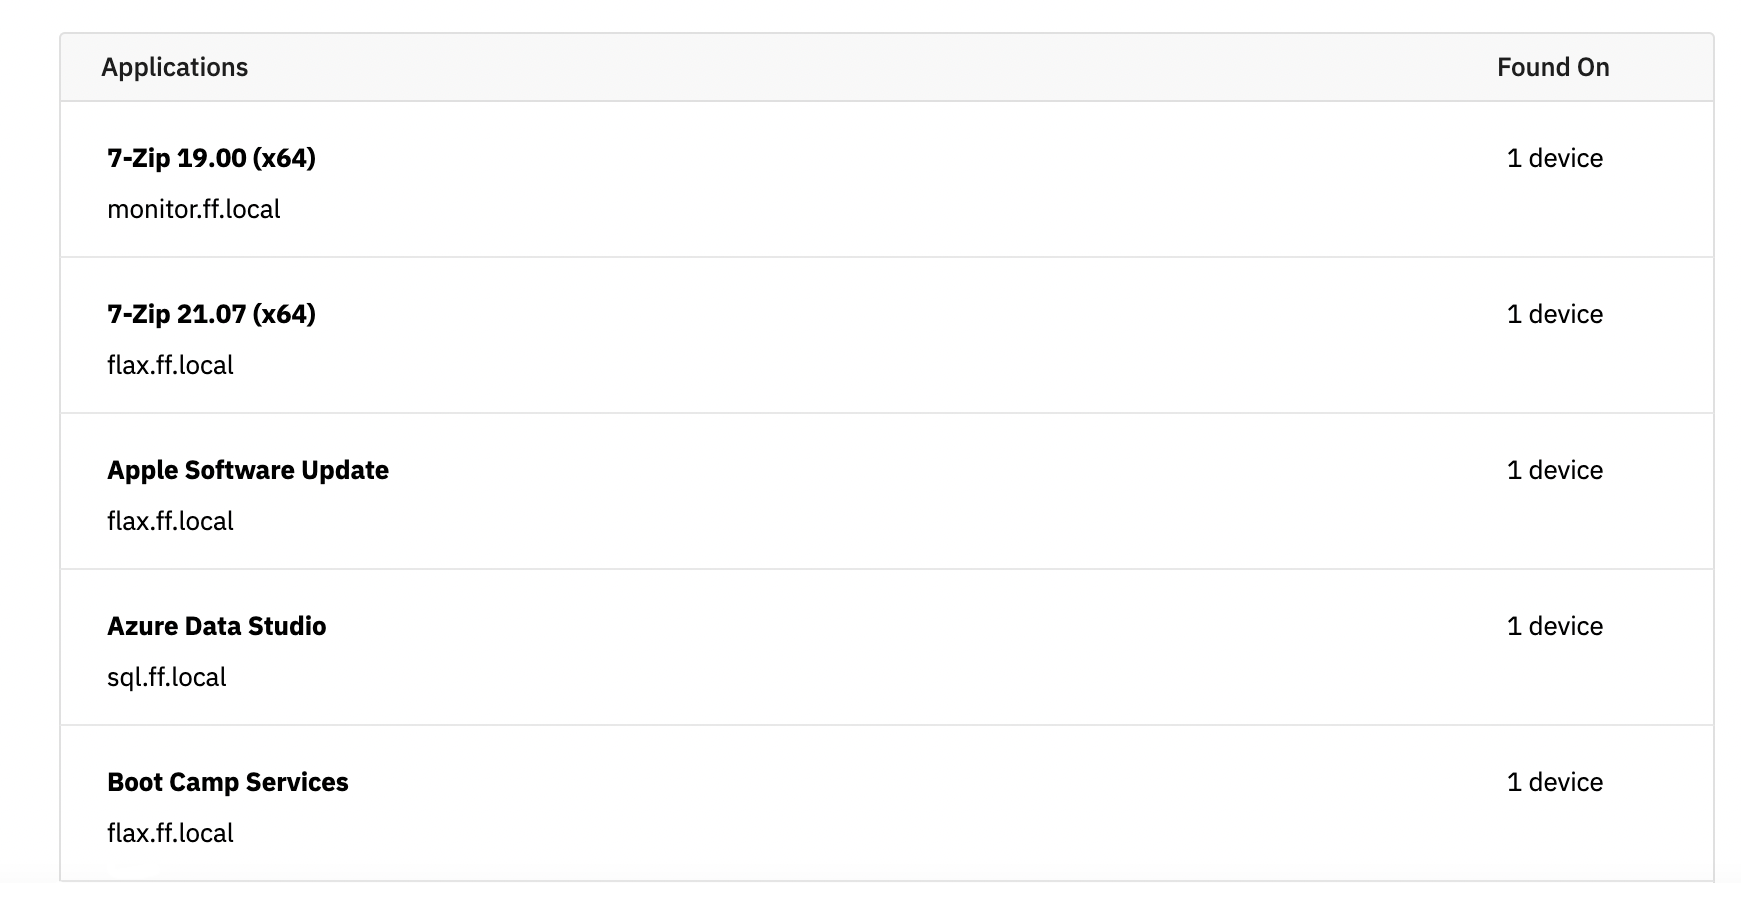
Application inventory reports list each application found on your devices and show how many and on which devices each application is installed.
 Application Report
CPU Inventory
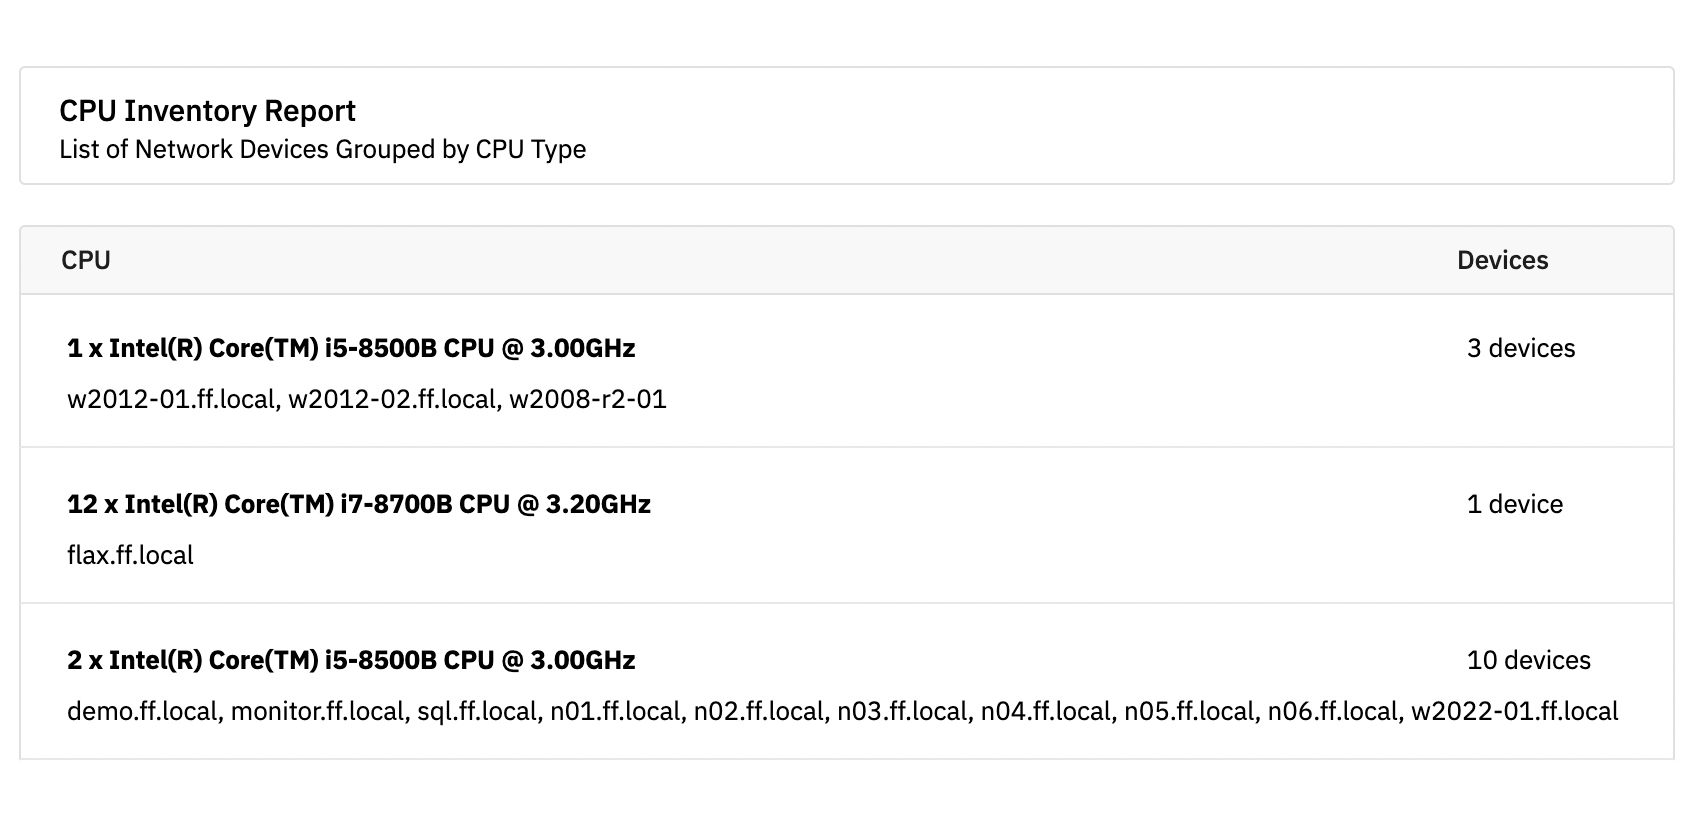
CPU inventory reports divide your network devices into groups based on what kinds of cores they have. You'll be able to access both the types and the number of cores on each one.
 CPU Report
Hardware Inventory
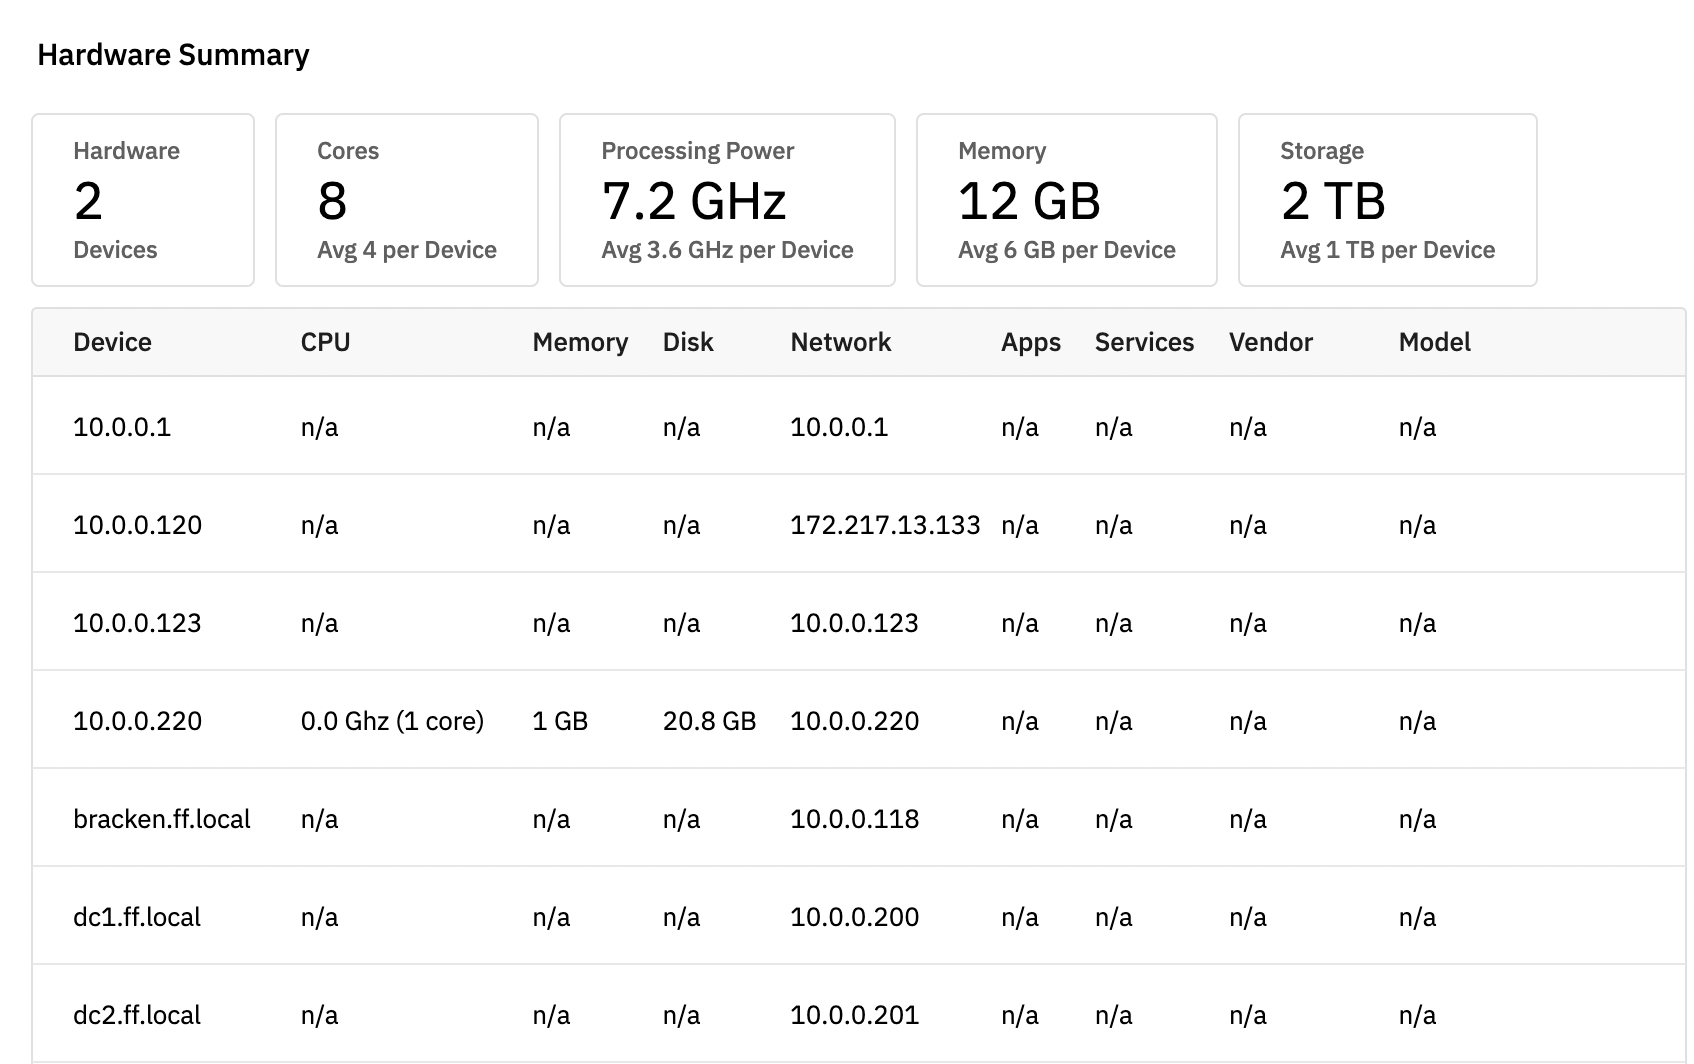
This inventory report type provides a summary of all the hardware associated with your network devices. This type of inventory reporting benefits from the inclusion of a summary header, which reflects at a glance the processing power, memory, storage, and the number of cores detected.
 Inventory Formatting Option
If desired, you can add a summary header to any other type of inventory reporting by choosing "Inventory Table with Summary Header" in the "Inventory Format" section of the inventory section's settings.
 Hardware Inventory Report with Summary Header
Memory Inventory
Memory inventory reports categorize your network devices by the amount of memory installed on each device.
 Memory Inventory Report
Service Inventory
This inventory report type shows a list of all Windows Services installed on your devices and shows you which devices (and how many) have each service installed.
 Service Inventory
OS Inventory
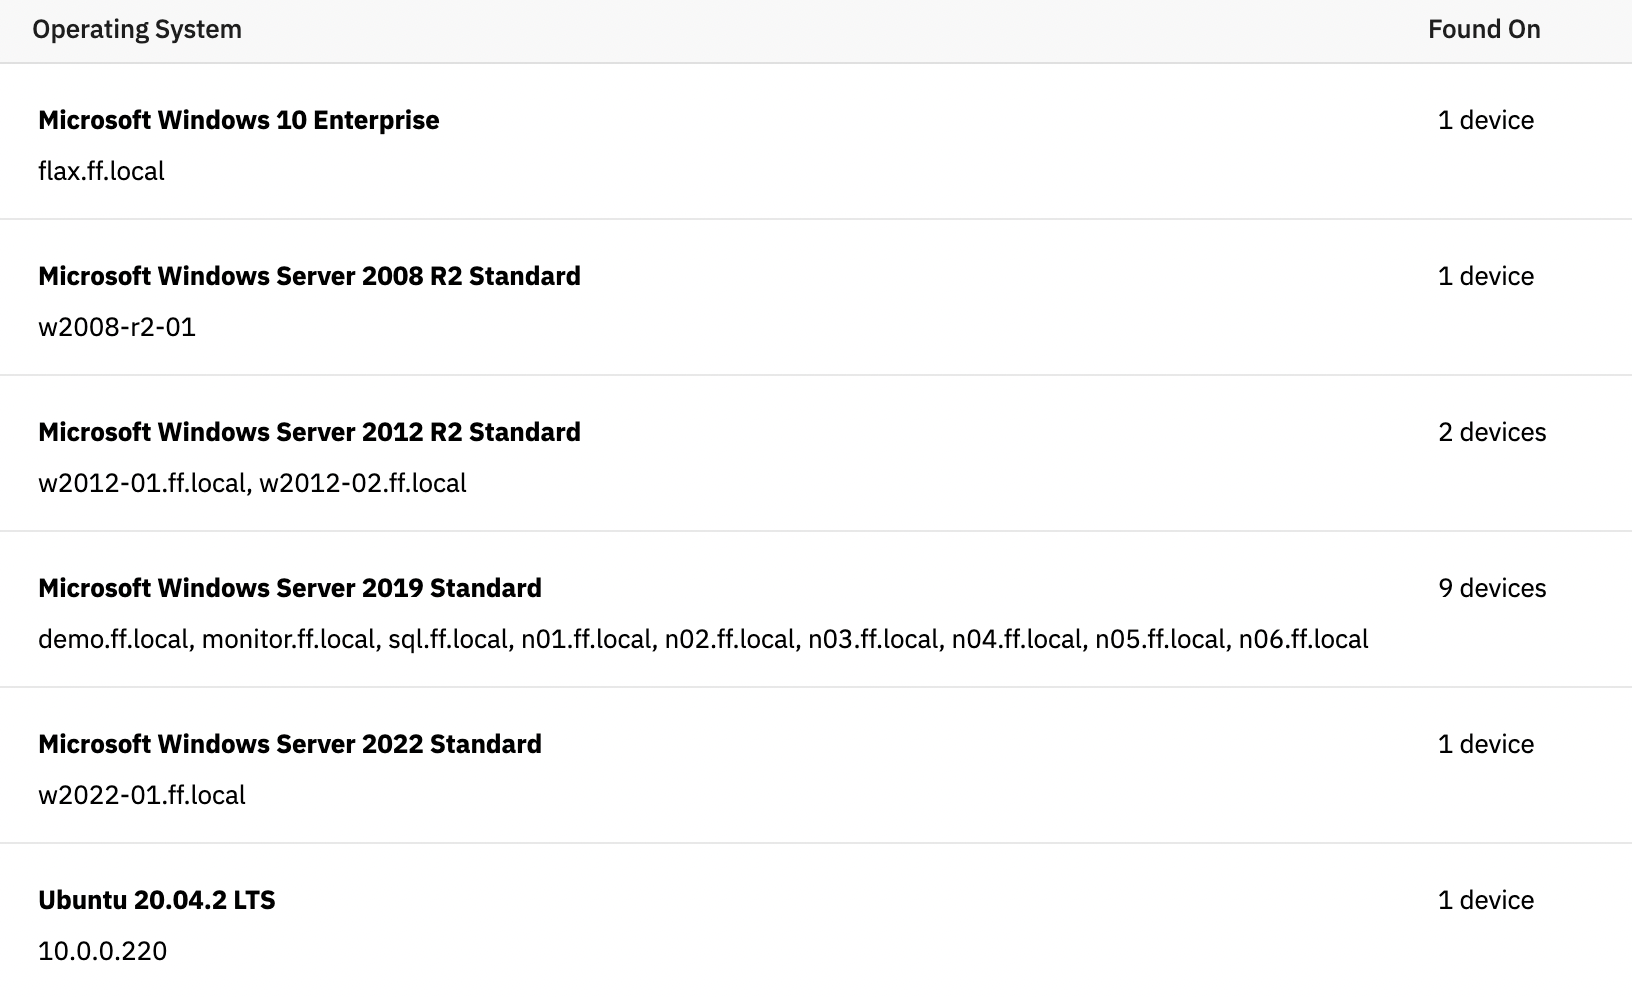
An OS inventory report table will show you a list of all your devices broken down by what OS version is installed on them.
 OS Report
Summary
Now that you know about all the types of inventory reporting FrameFlow supports, what are you waiting for? Download now to take it for a spin for free for 30 days and start taking advantage of its enterprise IT monitoring features. Also, check out our first and second blog posts about reports for further reading.