FrameFlow Report Elements Walkthrough 2
Learn all About Reports from FrameFlow and How to Use Them
FrameFlow Reports
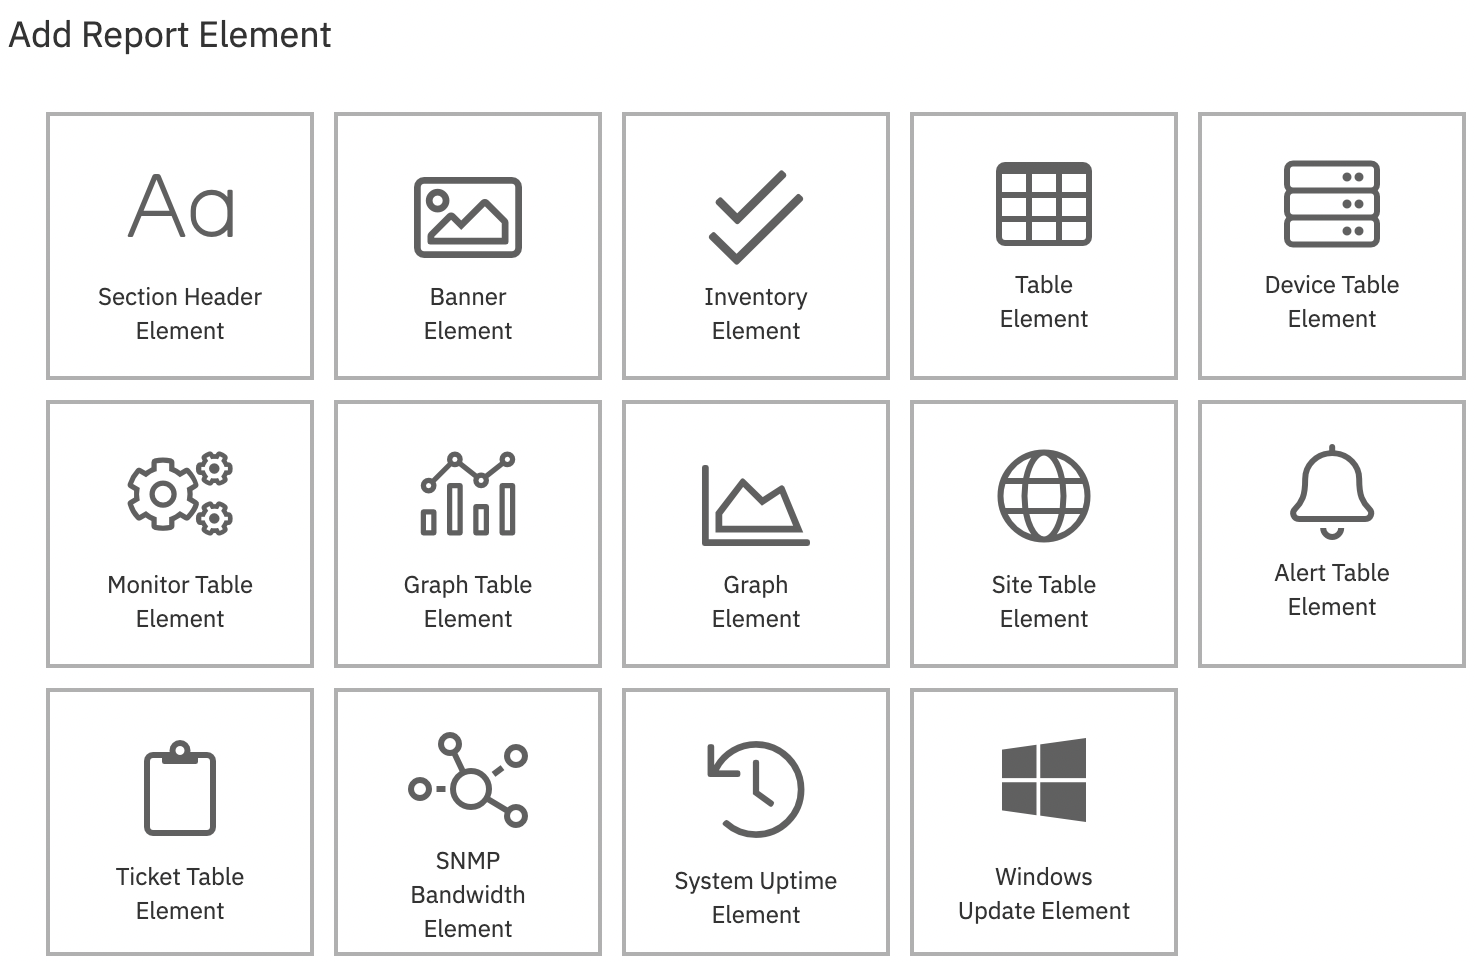
This blog post is the second in a pair that aims to highlight the functionality available in FrameFlow's Reports section. The first blog post went over the first half of the report elements you see below. This article will teach you about the remaining half, which are more advanced and specific elements that you can use to build out your reports.
 Report Element Menu
Site Table Element
Users with multi-site installations can take advantage of the site table report element as a way to view the status of all your sites in one table. You can also choose to include only sites that have lost contact. The report date range doesn't apply to this panel. This report element works as a snapshot in time from the moment the report was generated.
 Site Table Example
Alert Table Element
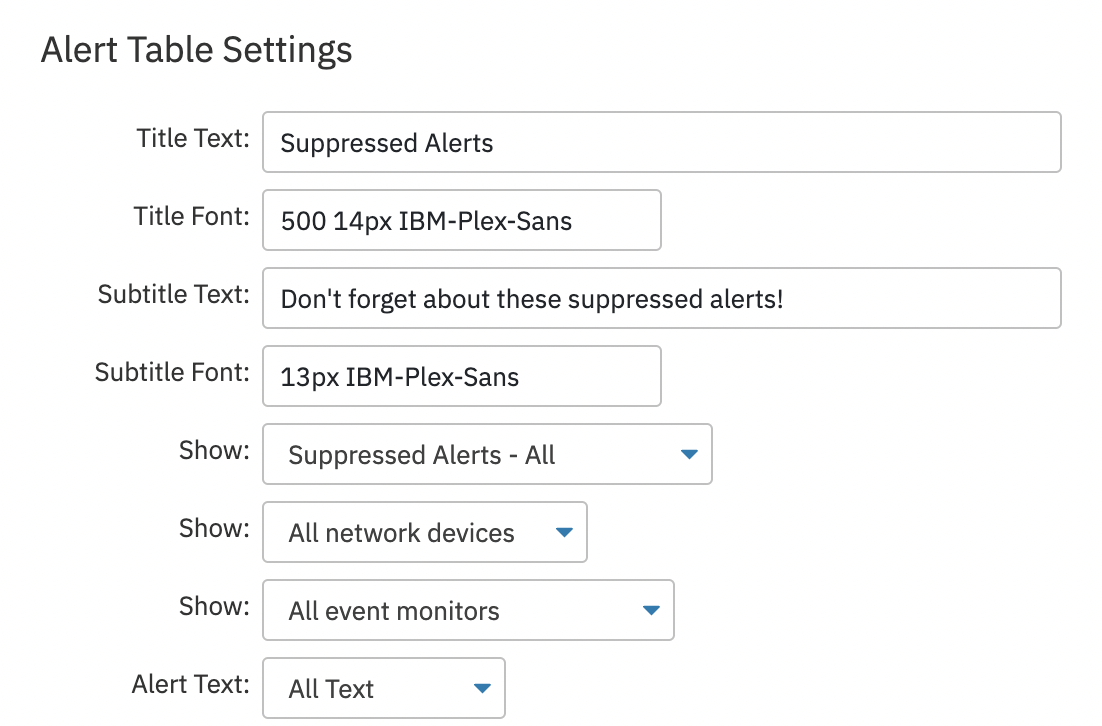
This element will create a table of current alerts for your report. By default, it will act like a snapshot of the Headquarters section and show the active alerts for all devices and monitors. You can also configure this element to show a specified subset of your overall monitoring configuration. Use the "Show" dropdowns to choose between active and repressed alerts and choose which event monitors and network devices will be used to gather data for this table. Use the settings to control the amount of data that is shown in the report.
 Report Table Settings
This panel gathers data from the moment the report was built, capturing the conditions of your monitoring configuration at that time.
Ticket Table Element
Similar to the alert table element, the ticket table element will show you all unresolved tickets for the event monitors and devices you specify. You can also filter the tickets shown in the report element by status. By default, the element will show all tickets, but you can also view assigned tickets, open tickets, in-progress tickets, overdue tickets, or tickets that have been recently closed, depending on your purposes.
 Report Table Settings
SNMP Bandwidth Element
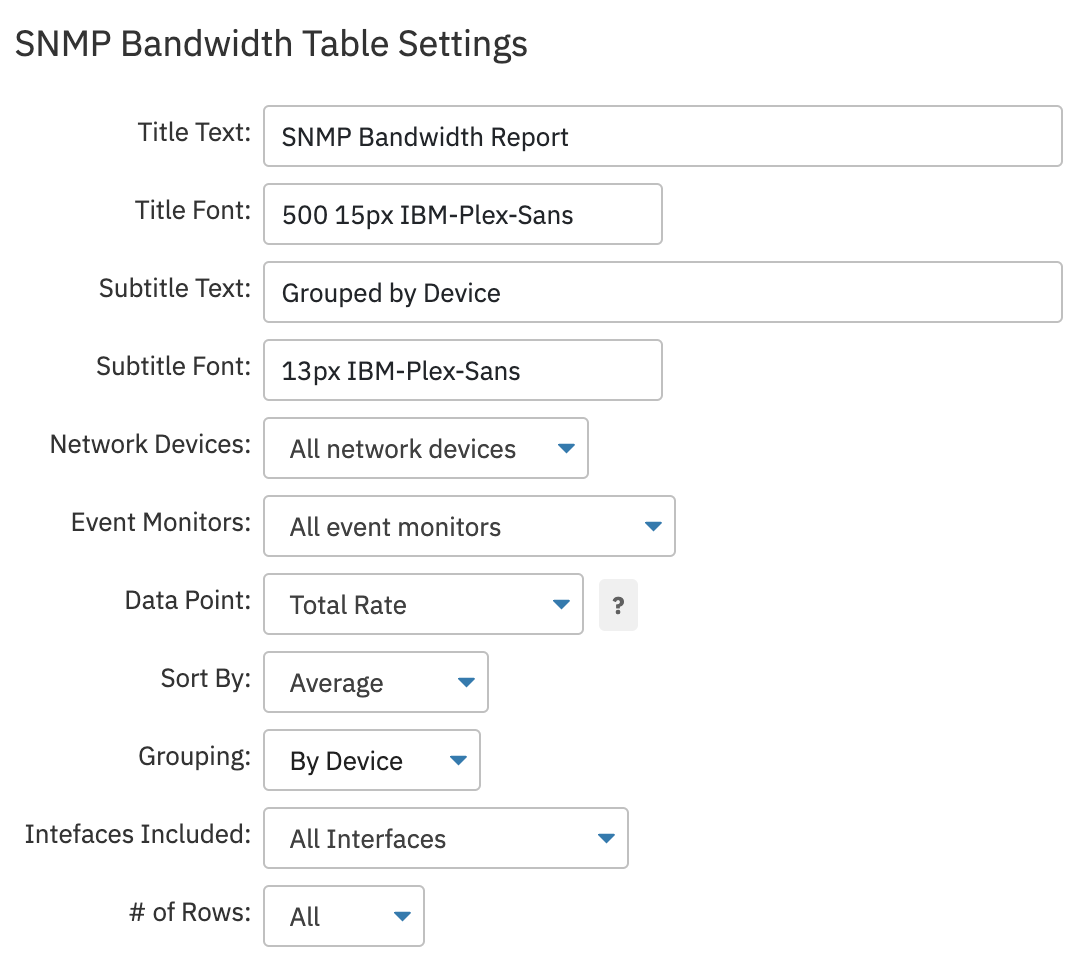
The SNMP bandwidth element watches your SNMP Bandwidth Event Monitors and generates data based on their statuses. Thanks to its robust settings section, you can customize this panel in a variety of ways. You can sort by device name and you can also use the "Network Devices" and "Event Monitors" dropdowns to confine the data shown by the panel to only a subset of your SNMP bandwidth monitoring configuration.
Choose which SNMP bandwidth value your panel will watch by setting its data point. If you choose a data point that's measured by percentage, make sure the SNMP Bandwidth Event Monitor is configured to monitor the percentage of the interface rate. Use the "Sort By" option to select sorting by minimum, maximum, or average values for the data point you have chosen.
 SNMP Bandwidth Settings
The most powerful feature of our SNMP bandwidth element is its grouping feature. With this option, you can choose to group the data gathered by this panel by network device. This helps with the layout and organization of some reports and also gives you a quick way to view status on a per-device basis.
 SNMP Bandwidth Element
System Uptime Element
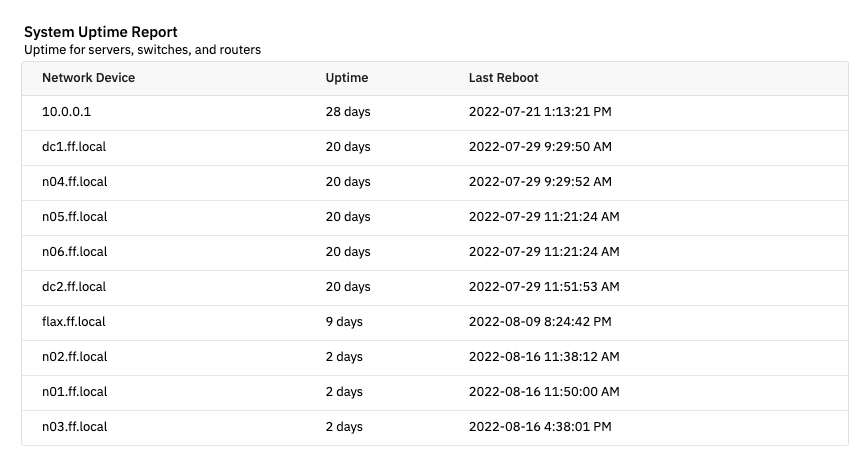
The system uptime report element reports on system uptime for all your associated devices and displays uptime and last reboots. Use this panel to keep an eye on key devices and receive notice of any unplanned reboots or updates as soon as your report is generated. This report element and the following one also work as a snapshot in time.
 System Uptime Element
Windows Update Element
To use the Windows Update report element, select the network devices and event monitors you want to feature on this panel. Using the "Update Type" dropdown, choose between Windows Updates, cumulative Windows Updates, or Windows Defender Updates. The element will only report on the types of updates you choose here. The panel will display each network device along with the time elapsed since the last update. The date of the last update is also available for easy viewing.
 Windows Update Element
Summary
This article highlighted the second half of the report elements available in the Reports section of FrameFlow. We hope this series helped you get the most out of our product! If you haven't checked out our tutorial on the Reports section yet, it's a great place to get started with building reports that summarize the conditions of your monitoring environment.
Are you new to FrameFlow? Download now to take it for a spin for free for 30 days and start taking advantage of its enterprise IT monitoring features.