What’s New in FrameFlow v2019.2
Learn All About Headquarters and Other Brand New Features
New Feature: Headquarters
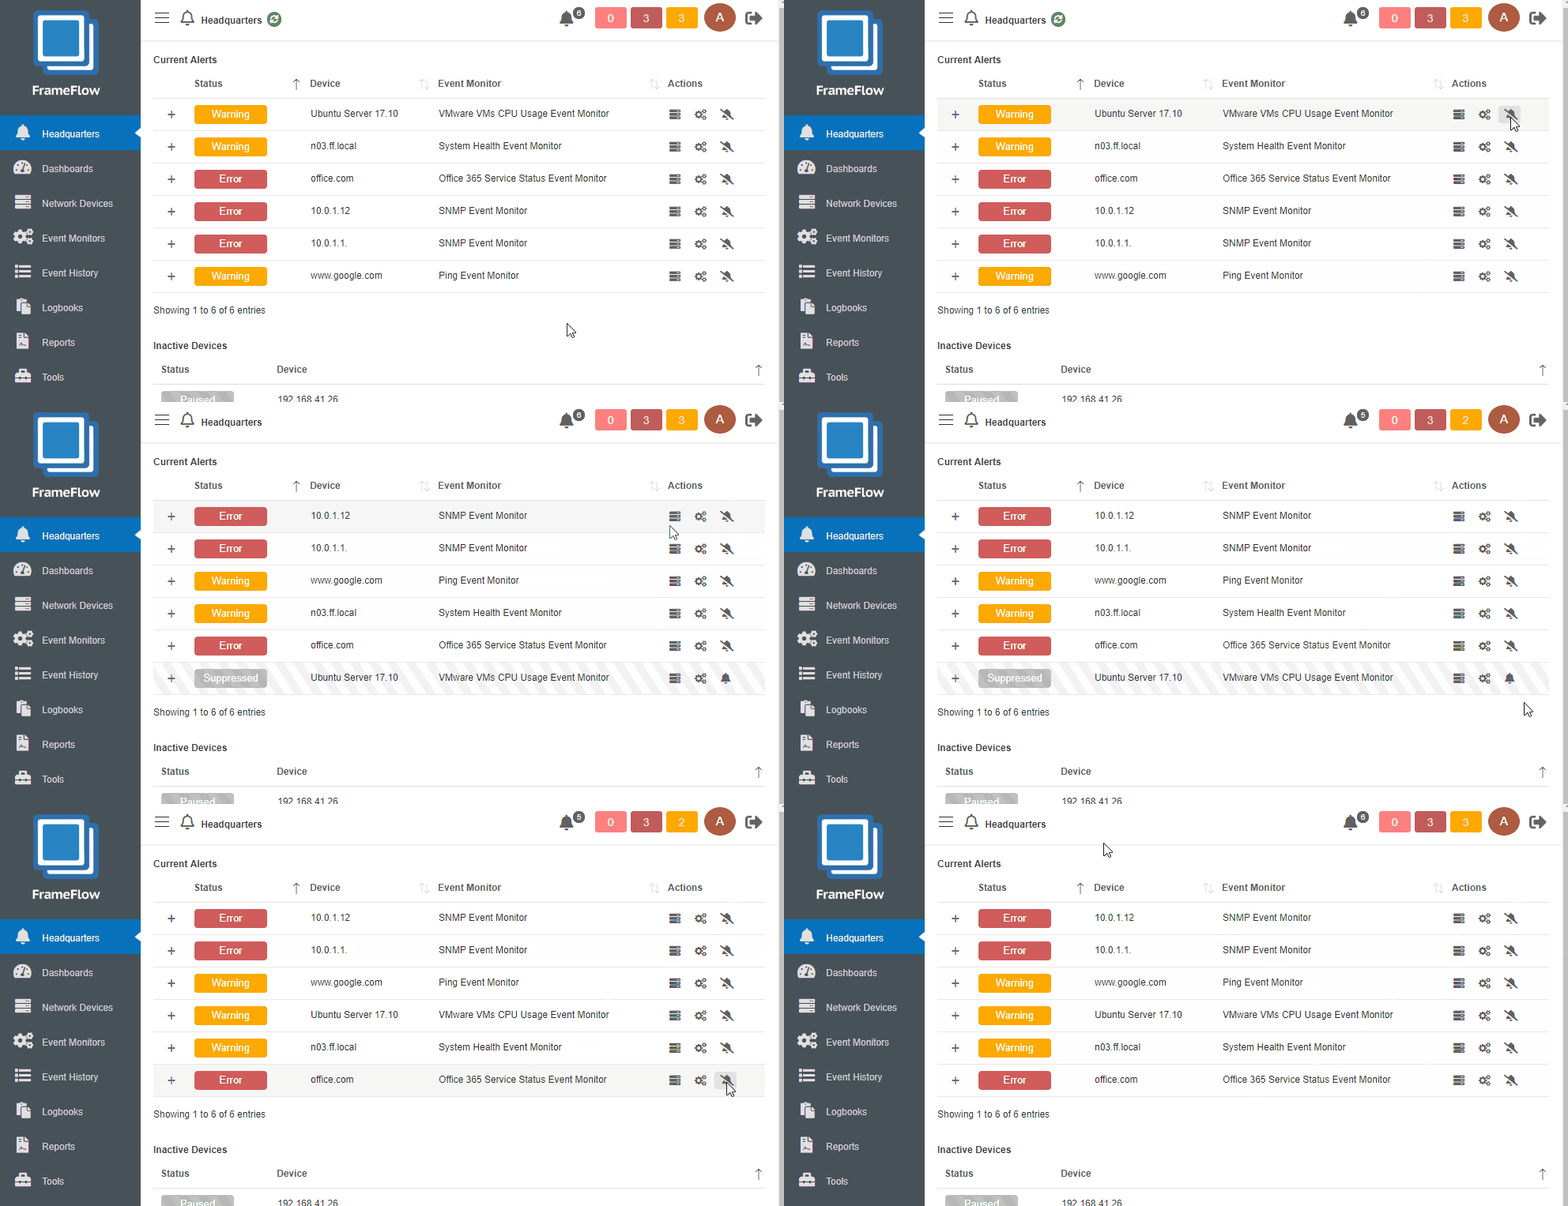
FrameFlow v2019.2 add a new top-level feature called Headquarters. Headquarters aims to be your master view of all current alerts. All in one place, it lists the device/monitor combinations that are currently in a non-success state. Headquarters also introduces the new ability to suppress alerts.
When you suppress an alert, your event monitors will continue to check the device but will not alert about failures. You can choose to suppress an alert "Once" in which case it will drop off the list of alerts until the next time the event monitor runs. Or you can select to suppress an alert "Always" which keeps it suppressed until you manually unsuppress it.

Notification Icon for Alerts
Also new is the notification icon on the main taskbar. No matter where you are in the FrameFlow interface you can hover over the bell icon to see a list of the most recent alerts. There’s also the option to go directly to Headquarters to see the full list of alerts and control their status.
When there’s a new alert, FrameFlow will now play a short sound through your browser. It even works if FrameFlow is running in a background tab, giving you a great way to keep on top of alert status even when you’re working on something else. On the other hand, if you value your peace and quiet, you can always turn off sound alerts in the User Interface section of the Settings.
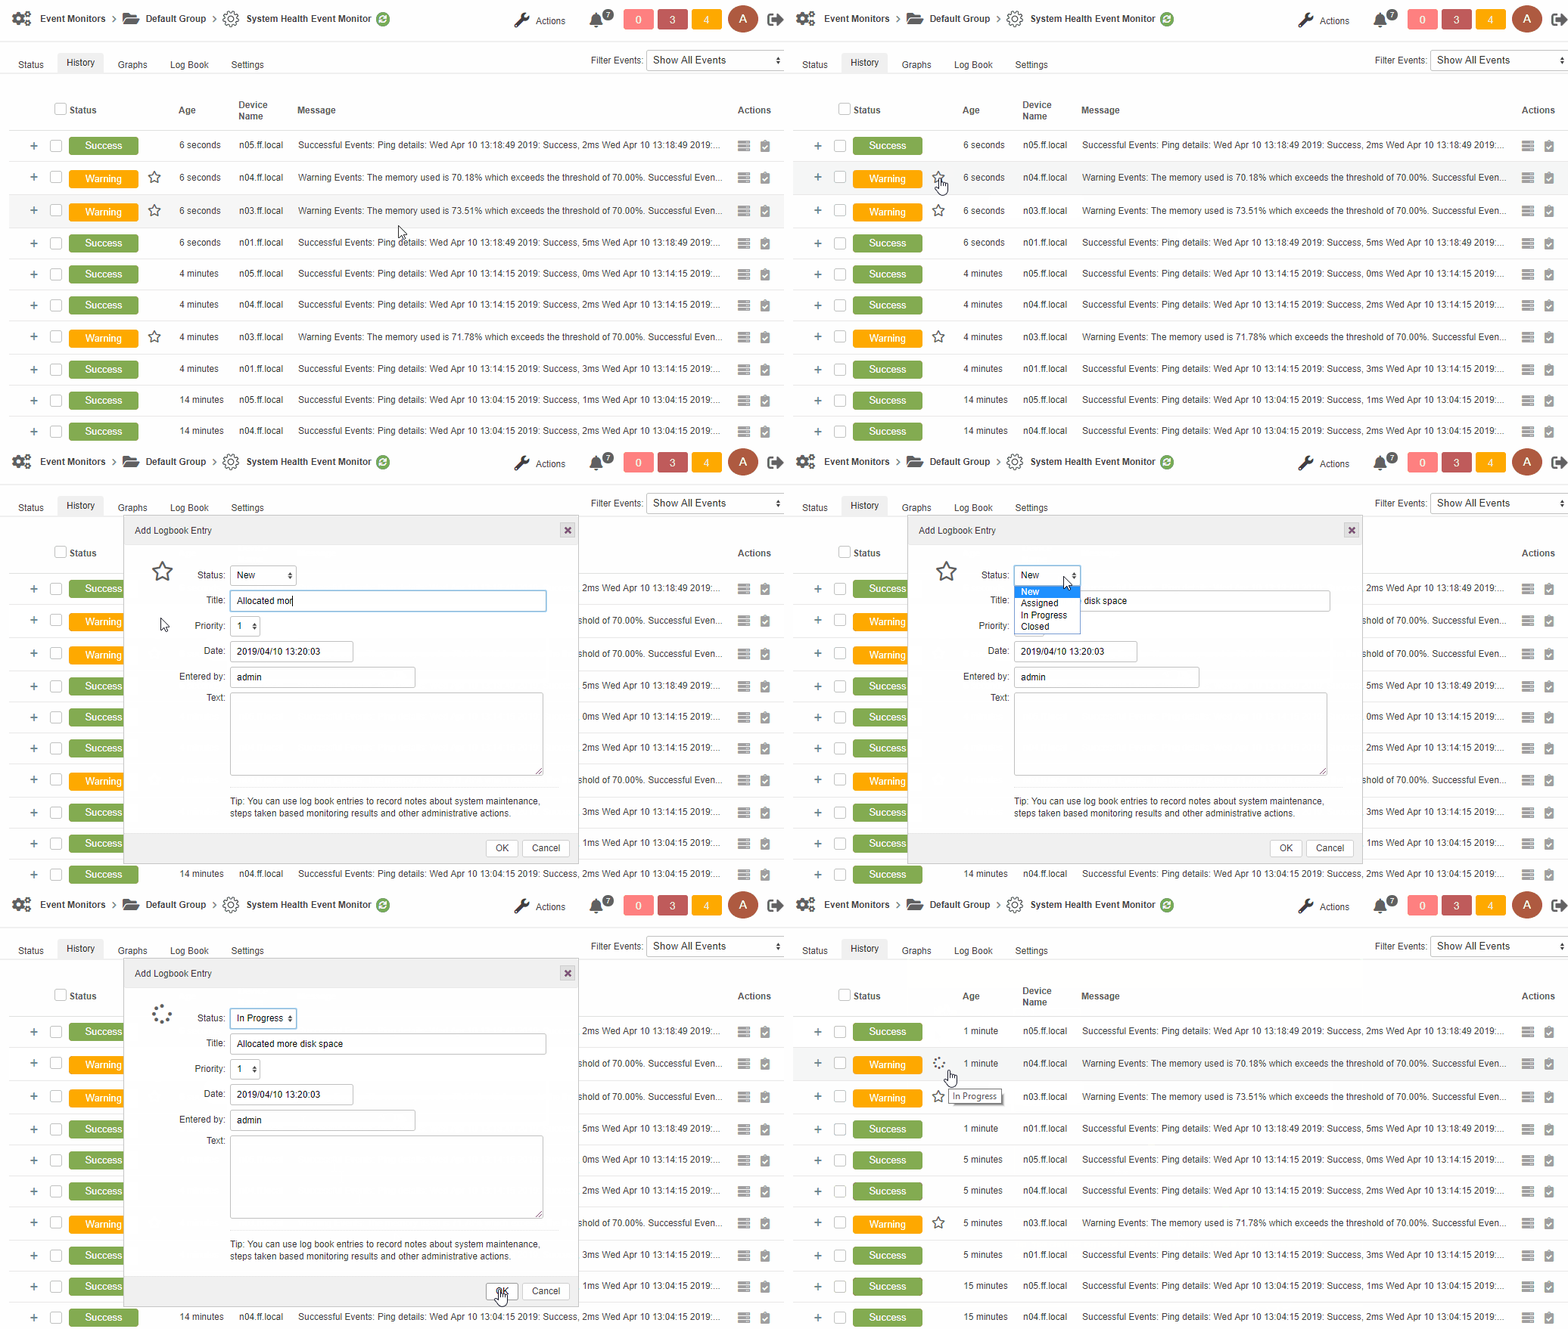
Non-success events can now be automatically assigned a "New" status and a star icon will appear beside them. Clicking on the icon will allow you to change the status, describe the alert condition and add free-form details about progress, resolution or any other details that you wish to record.
Workflow and Logbooks
Many of our customers have established workflows to help them manage new alerts and track them through to resolution wherever possible. In previous releases, there was the ability to mark events as viewed or unviewed. FrameFlow would mark new non-success events as "unviewed" and later you could mark them as "viewed", serving as a basic mechanism for showing that an alert had been handled.
In FrameFlow 2019.2 we have replaced the viewed/unviewed model with enhanced logbook features that offer more status levels and improved workflow options.

Logbook entries are attached to event history records. It’s good practice to review your notification profile settings to make sure event history records are generated for any conditions that you want to track with logbook entries. Some of you prefer to record event history records for all events (success and non-success), others prefer to record on state-change only. Both methods are great but to take the best advantage of the new logbook functionality you may want to generate event history records for all events or at least all non-success events.
See the Logbooks section in the settings for more options to control how and when event history records are marked as new.
Other New Features
During testing, the feedback we received said that the new Headquarters feature was by far the best way to keep track of current alerts. It only made sense to make that same information available on dashboards so we’ve added a new dashboard element that shows the list of current alerts using the same format Headquarters uses. Make room for it on your existing dashboards or even consider giving it a dashboard of its own.
The alert suppression feature that we described earlier works not only in the new Headquarters section but also on the status tabs for devices and for event monitors. No matter which section of the interface you are working in, you have complete control over alert status and suppression.
Throughout the interface, you’ll also see improved status markers. Instead of small square markers with only color to indicate status, the status is now clearly displayed on a larger rectangular badge.
Also new are improved status indications for devices that are currently in a maintenance window. The interface now adds indicators in the tree and in device lists, clearly showing that a device is in maintenance and won’t be monitored until the maintenance window is over.
Available Now
FrameFlow v2019.2 is available now. To upgrade, log into your account on our web site and select the downloads tab. If you have comments or suggestions, send them our way. We’d love to hear what you think about the new features and functionality.
Try FrameFlow Now
Are you new to FrameFlow? Take it for a spin for free for 30 days and starting taking advantage of its enterprise IT monitoring features.