What's New in FrameFlow v2025.1?
Learn What has Changed, What's Stayed the Same, and What's Coming Next
Welcome to FrameFlow's first major release of the New Year. Included in FrameFlow v2025.1 are four new event monitors, new features for Installation Health, Dashboards, and Microsoft 365 monitors, and even more. We'll cover this update's highlights in today's What's New post. To view all changes, make sure to visit our change log.
New Windows Event Monitors
Two of our latest event monitors are Windows-based: the Windows Firewall Event Monitor and the Windows Network Profile Event Monitor. These new additions join our roster of over 20 Windows event monitors.
The Windows Firewall Event Monitor checks Windows servers that you specify and alerts on the state of Windows Firewall. It can tell you at a glance whether Firewall is enabled for Domain, Private, and Guest or Public Networks. It provides a great way to be reminded about the state of network traffic filtering on your Windows servers.
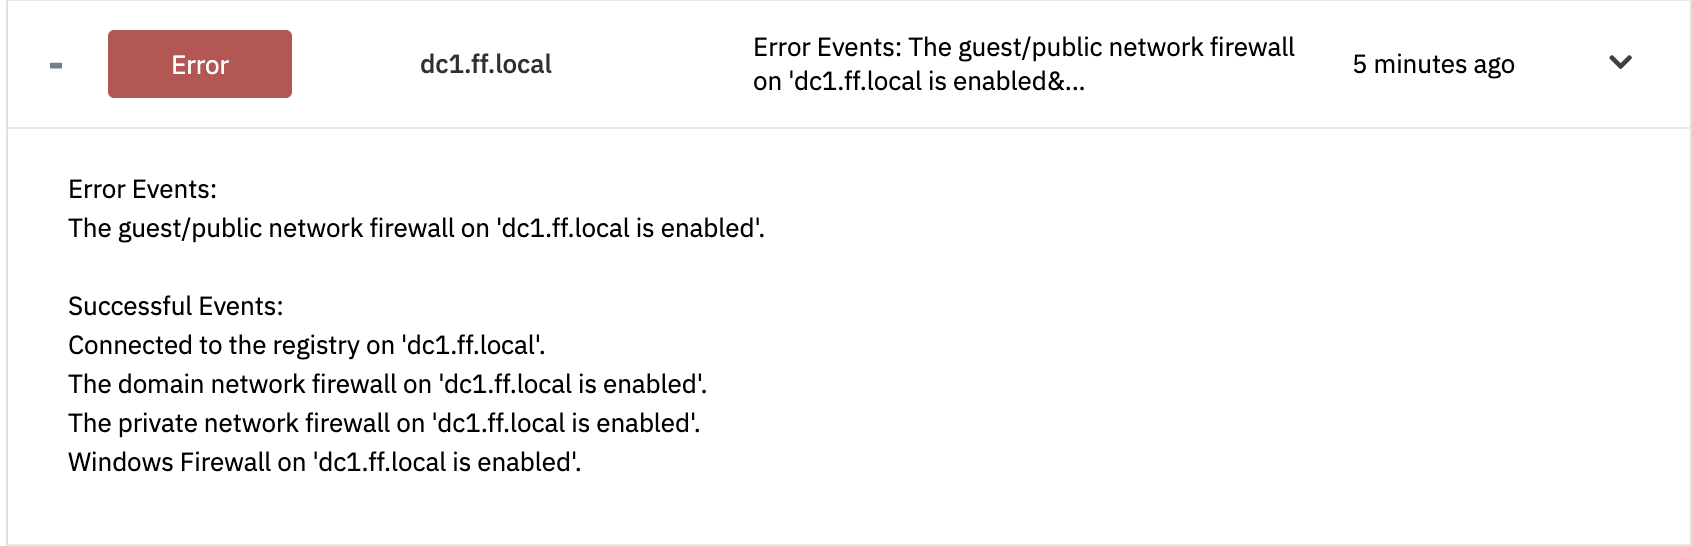 Windows Firewall Event Monitor Output
FrameFlow's all-new Windows Network Profile Event Monitor checks remote machines and alerts on the state of Windows network profiles and whether or not the Domain Network Profile, Private Network Profile and Guest or Public Networks are active or 'connected.' Now, you can view the network profiles connected on your Windows servers directly from the FrameFlow interface. You can even include a list of all connected network adapters in the event history the monitor generates each time it runs.
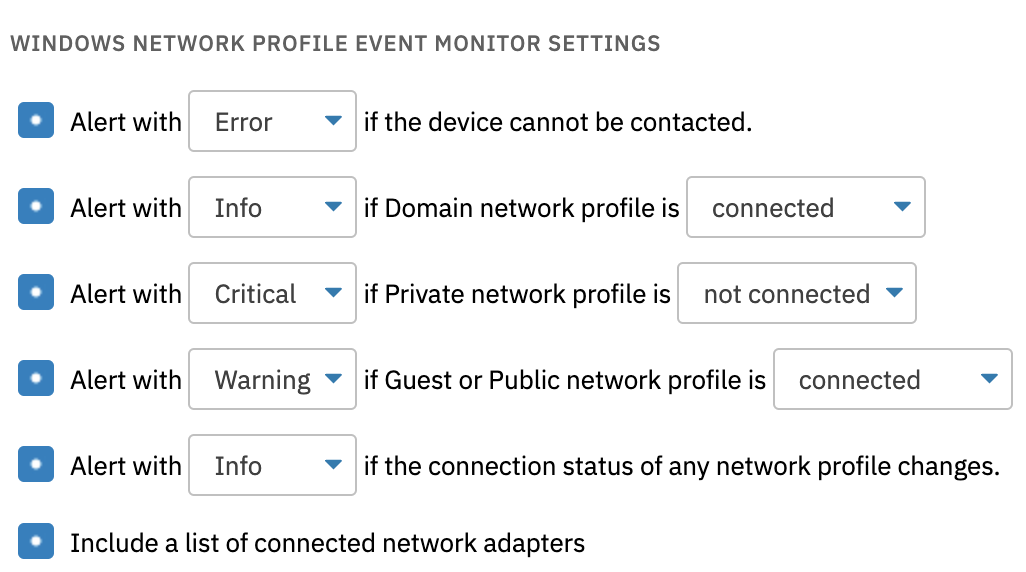 Windows Network Profile Monitor Settings
New: PowerShell Repository
Our new PowerShell Repository Event Monitor runs Windows PowerShell scripts from a repository that you can develop to monitor conditions that are specific to your environment. Together with the new PowerShell Repository settings section, these tools let you create custom scripts and execute them across the FrameFlow interface. In this new update, we've added the ability to save your PowerShell scripts the way you can with other parts of our interface, like notification profiles and authentication profiles.
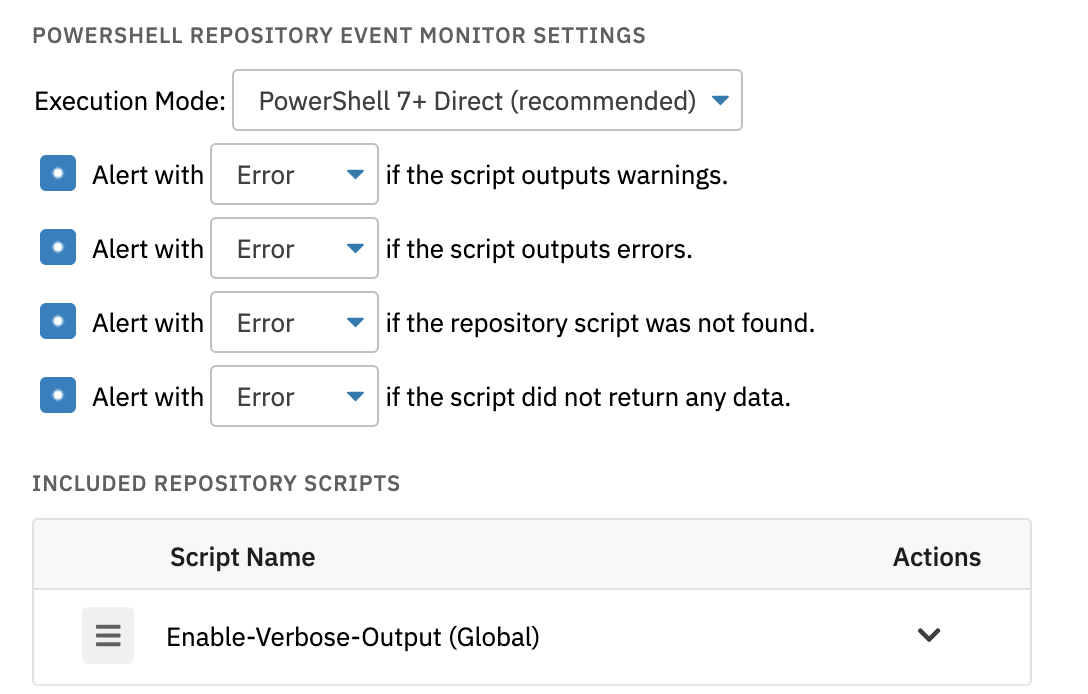 PowerShell Repository Event Monitor
The PowerShell Repository Event Monitor lets you collect and execute your custom scripts all under one event monitor. This lets you perform multiple custom monitoring tasks on the same network devices and even add onto your repository scripts, maximizing reusability. Please get in contact for help creating and implementing custom monitoring actions with PowerShell. We're happy to help and always excited to see what our users have come up with.
New: Azure Metrics Event Monitor
FrameFlow's new Azure Metrics Event Monitor watches numeric data from Azure Metrics and lets you select specific metrics to monitor. This way, you can integrate Azure metric monitoring into FrameFlow's alerting engine. You can set the numerical thresholds that will trigger a FrameFlow alert and also choose the data type that matches the metrics you're tracking. Data from this event monitor can then be analyzed with our Dashboards or custom reporting software.
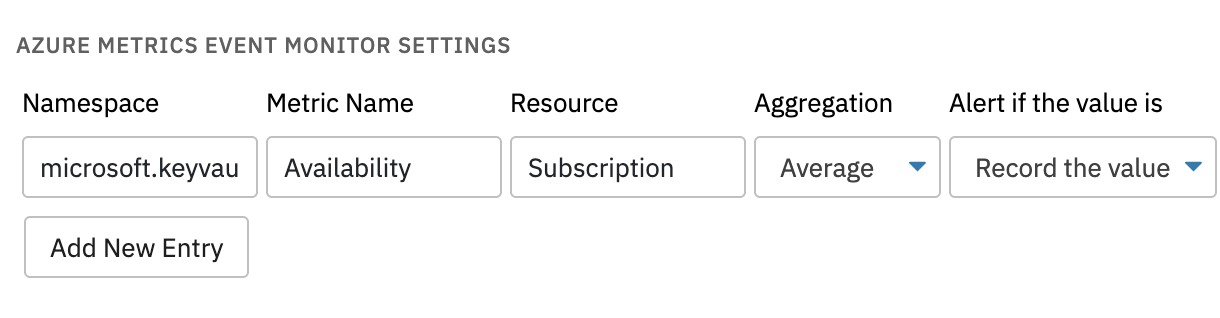 Azure Metrics Input Fields
Easier Navigation with New Icons
Also included in this update to our interface are new icons in the Authentication Profile and Maintenance Profile lists. We added icons so you can easily sort through these lists and choose the profile you need to interact with at a glance.
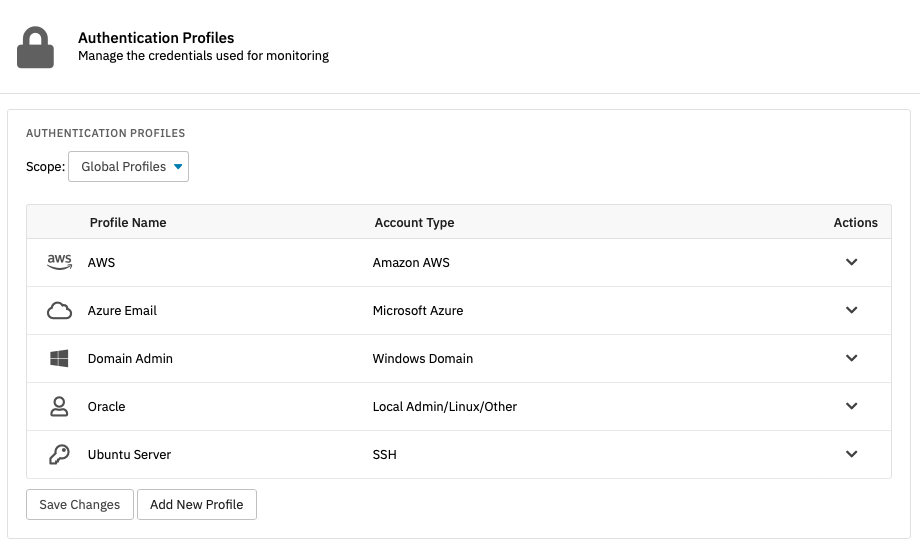 Authentication Profiles Section with Icons
New Device Chooser
Another important feature we've recently updated is our network device chooser. Our new device chooser has a right-hand panel that shows you the individual devices, devices groups, and tagged devices that you've chosen. Now, you can mix and match adding devices, tags and device groups all in one action, saving you time.
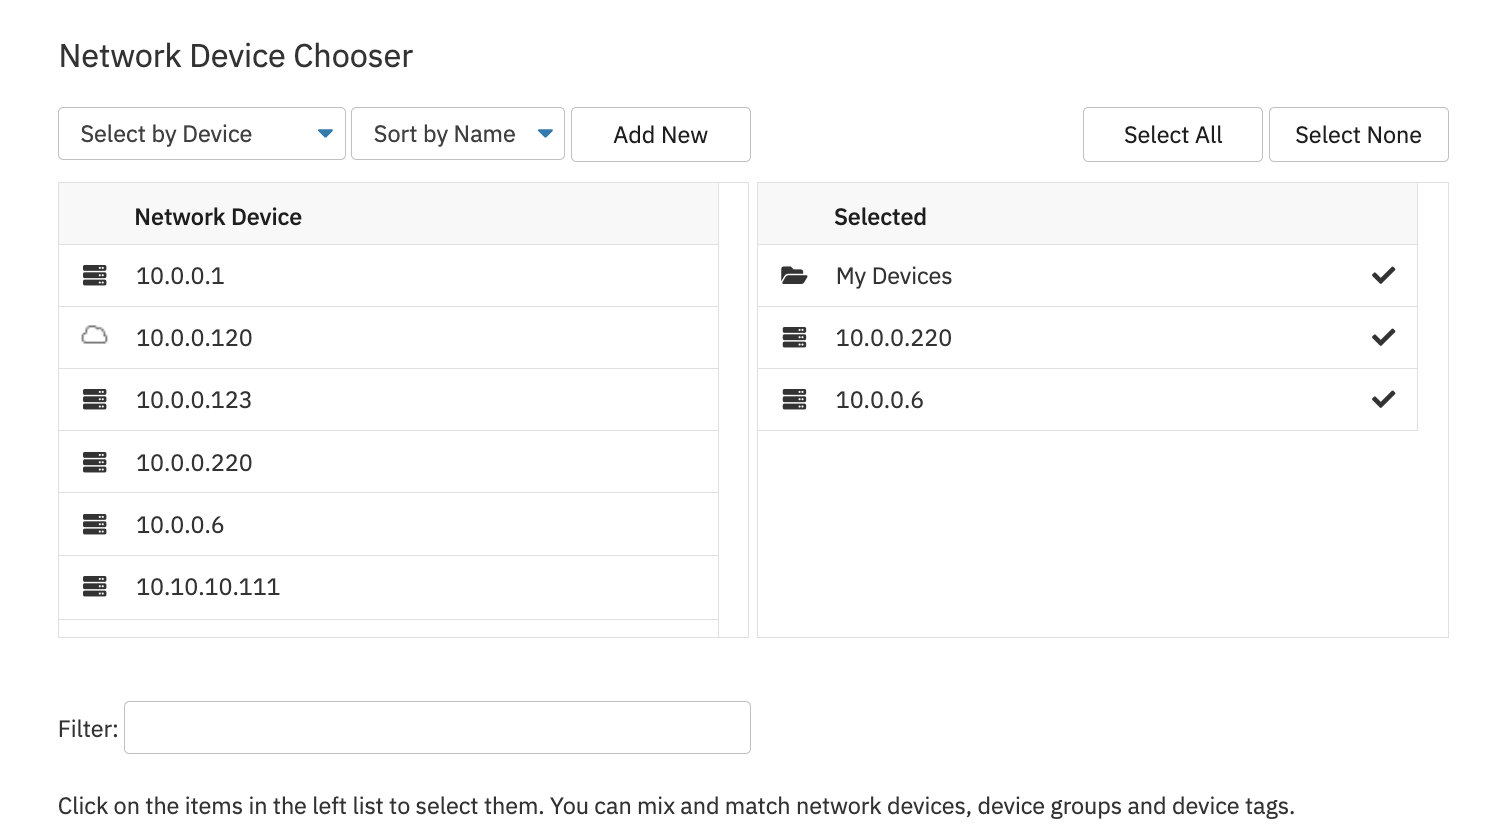 New and Improved Device Chooser
Other Feature Additions and Improvements
Aside from our three all-new event monitors, FrameFlow v2025.1 also contains tons of smaller features and fixes. Let's cover some here.
We improved our existing Installation Health Event Monitor with the new ability to alert about lost contact for remote nodes. We've also added tons of features to our Dashboards section, including adding lost contact counts to the Current Events dashboard panel. In the dashboard editor for all panels, we've added a handy option to revert your current changes. We also added the option to change font sizes for several dashboard panels to make these panels more legible on larger displays.
 Reverting Dashboard Changes
Update Today!
This article hasn't even covered all of the perks to upgrading to FrameFlow v2025.1. You can view all of the changes we've made in our change log. Make sure you log in and upgrade your instance ASAP to get all the new features.
Try FrameFlow Now
Not a current FrameFlow user? With consistent software support and regular new features, FrameFlow is a world-class IT monitoring tool. Download our trial now to try FrameFlow for 30 days risk-free!