What’s New in FrameFlow v2023.6?
Learn About the Latest Changes to our Integrated Monitoring Solution
What's New in FrameFlow v2023.6?
FrameFlow v2023.6 is now out and contains updates and bug fixes for existing features, including the Current Status dashboard panel, the Registry Event Monitor, the Azure Service Health Event Monitor, and much more. Read on to learn what's changed.
New Styles for the Current Status Dashboard Panel
FrameFlow v2023.6 also contains new additions to our Current Status dashboard panel. Previously, this panel had only one display style (Status Tiles). Now, you can choose between the three display styles below:
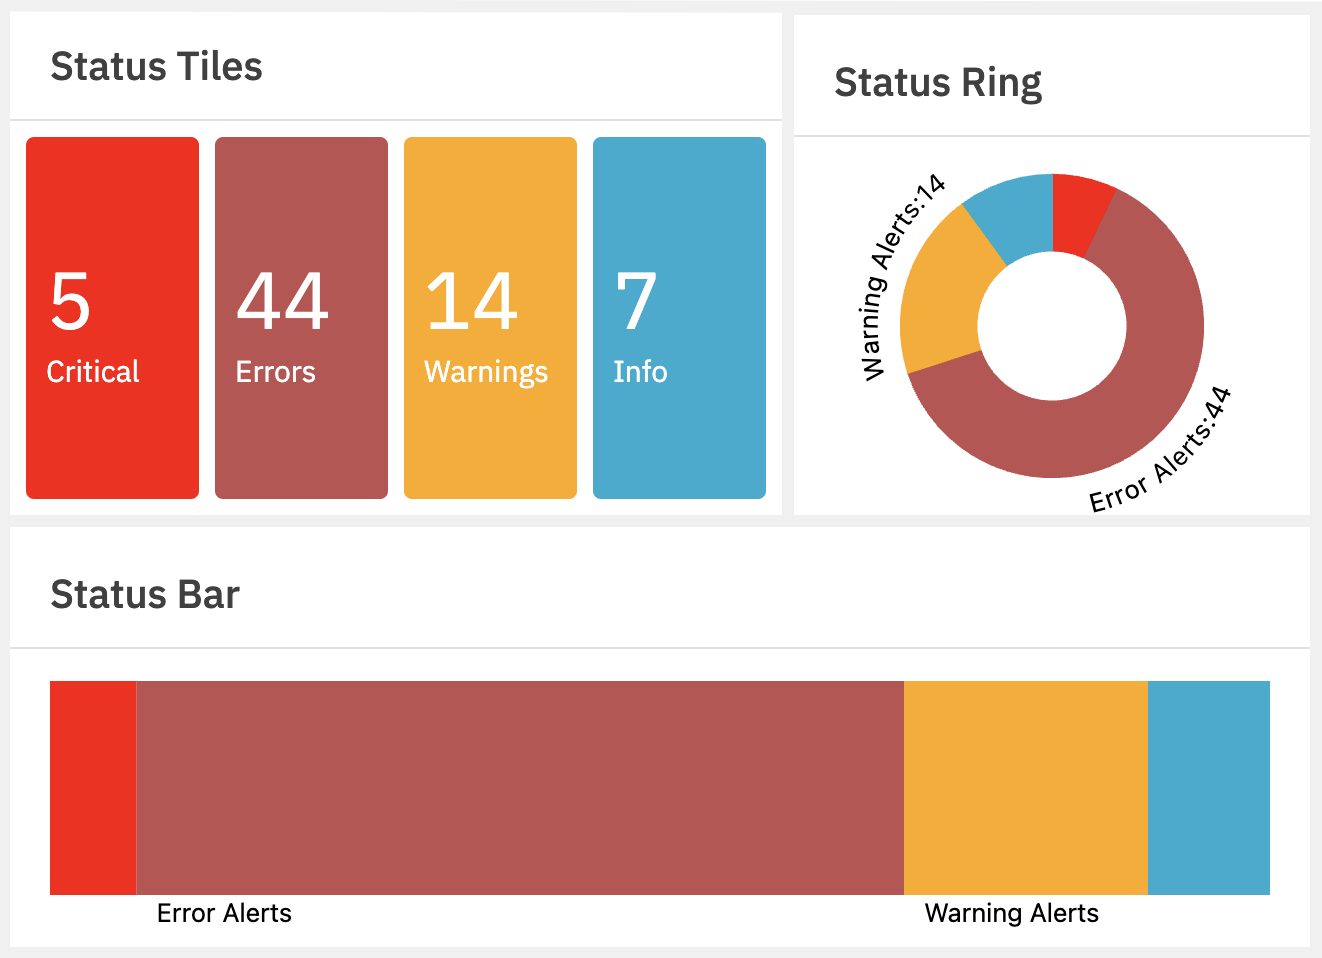 Examples of Each Status Style
Though the above examples display the same data, you can filter the data that's displayed by network device and event monitor using the panel's settings to show only a specific section of data in your dashboards. Sections of the display that are large enough will automatically have a label, like the warning and error alerts in the status panels above. For smaller sections, hover over them to view their labels.
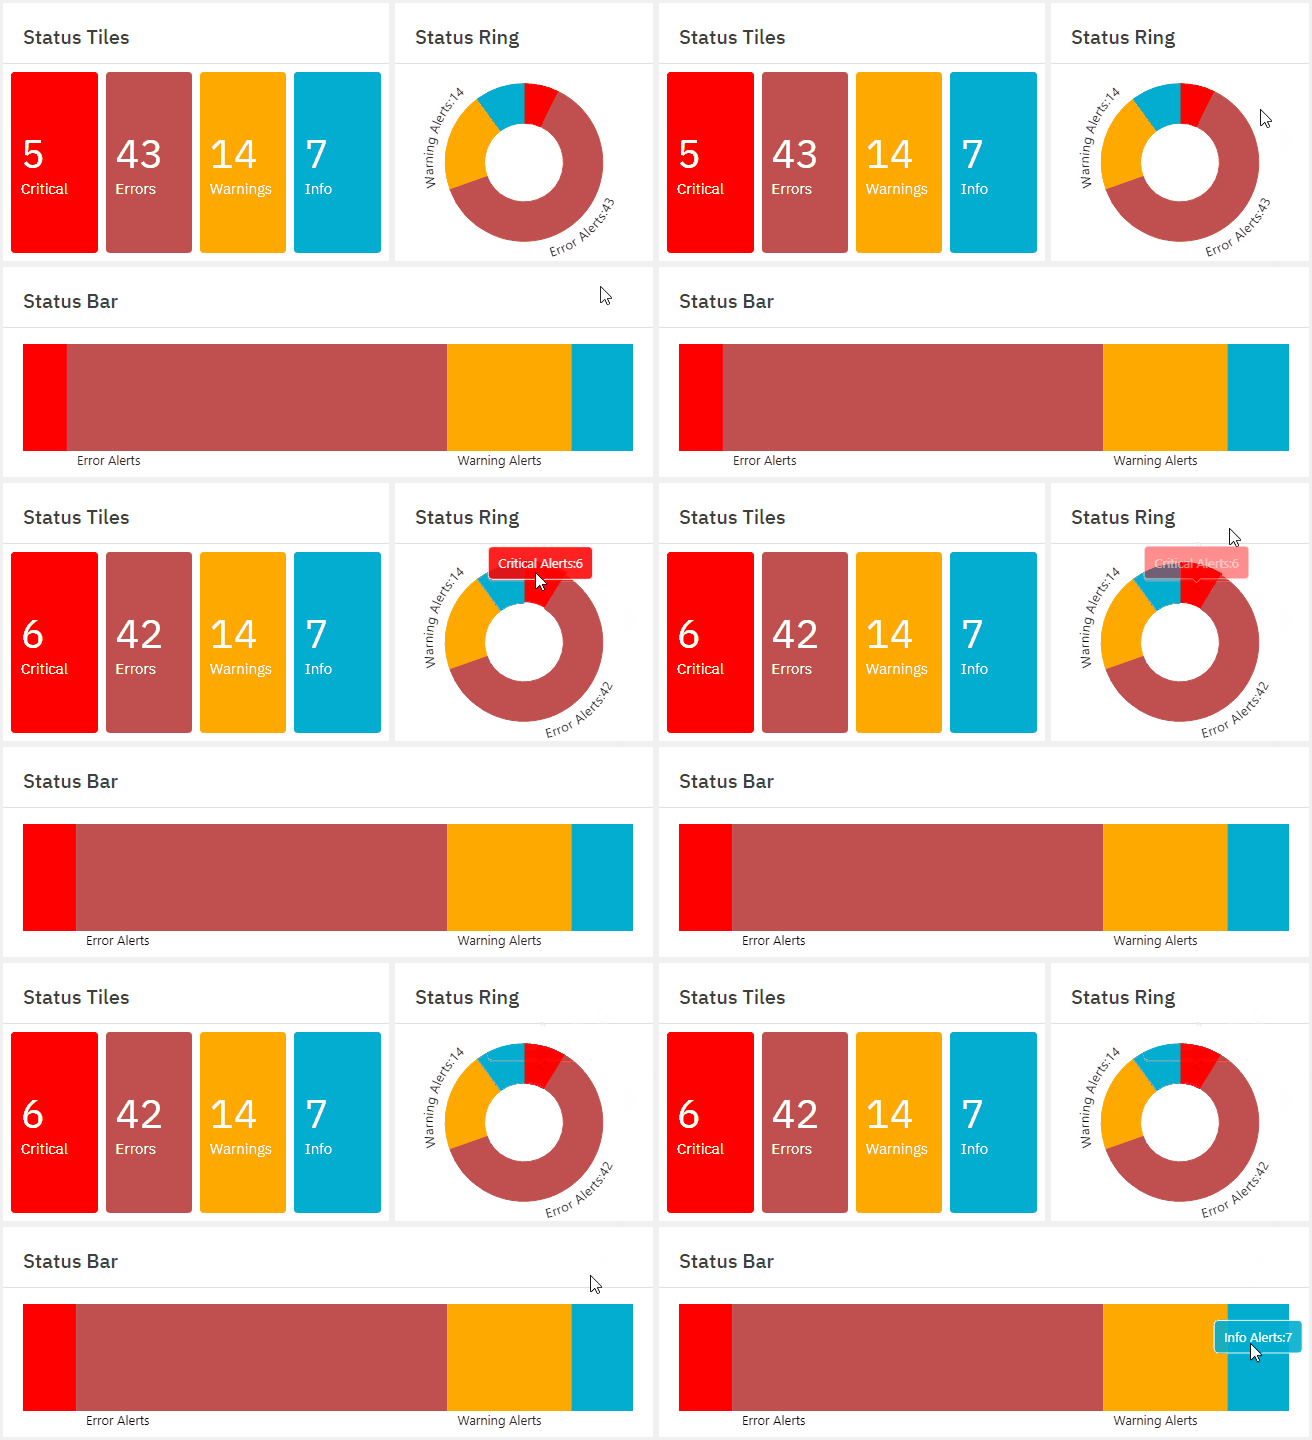 Viewing Status Labels
Registry Event Monitor Updates
In FrameFlow v2023.6, we added the ability to the Registry Event Monitor to search for partial numeric matches. Previously, this option did not exist for the "DWORD" value type and only existed if a user chose the "string" value type. This option lets you enter a string or partial string of numbers into the text box provided and will send you an alert if a match is detected. The inverse option also exists and with it, you will be alerted if the event monitor does not detect a match with the string you enter.
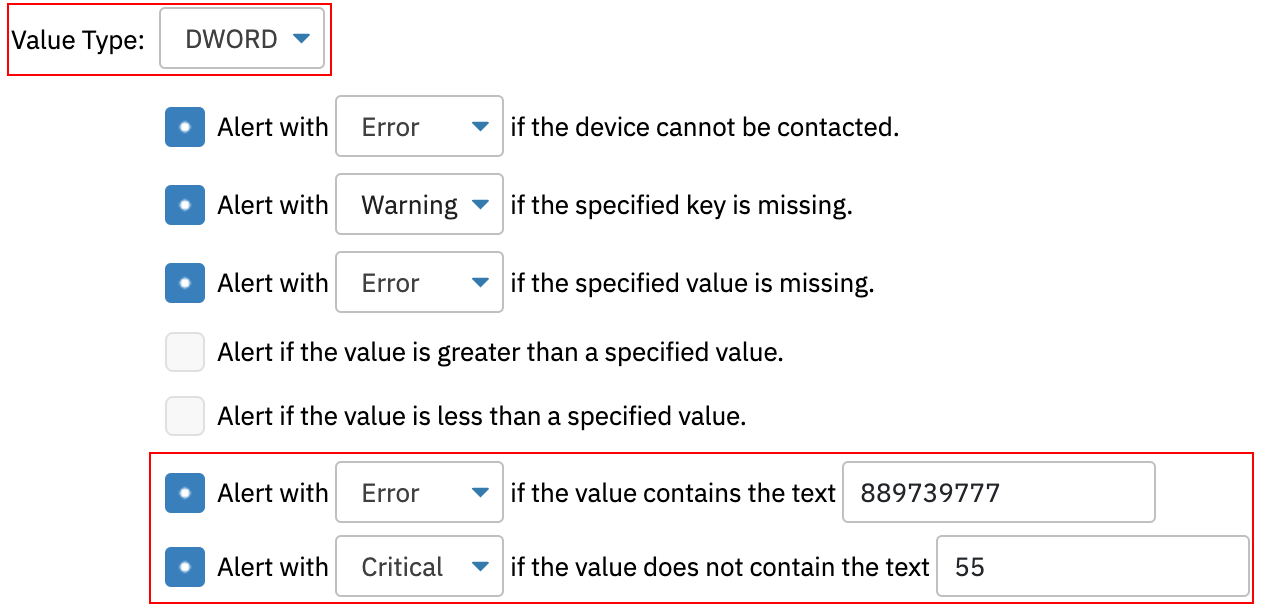 New "DWORD" Options
New Azure Service Health Data Points
FrameFlow's new Microsoft Azure Service Health Event Monitor previously didn't generate data points. Now, it generates three: Global Service Issues, Resource Health Issues, and Security Advisories. The Global Service Issues data point represents the number of Azure service issues detected by the event monitor. The Resource Health Issues data point counts the number of health issues detected with your Azure resources. The Security Advisories data point is a measure of the number of security advisories your event monitor has detected.
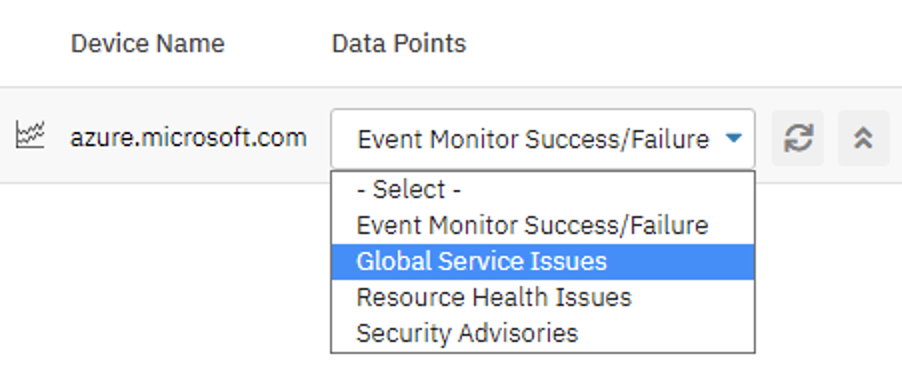 Azure Service Health Data Point Chooser
New Data Points for Windows and Linux Inventory Event Monitors
The Windows Inventory Event Monitor and the Linux Inventory Event Monitor each have two new data points: OS Kind and OS Number. Now, using a Data Point List dashboard panel, you can keep a list of the OS version and type of each Windows or Linux device available for easy viewing on company-wide or personal dashboards. This helps you figure out at a glance what version of Windows or Linux each device is running, allowing you to readily detect when a device needs to be updated.
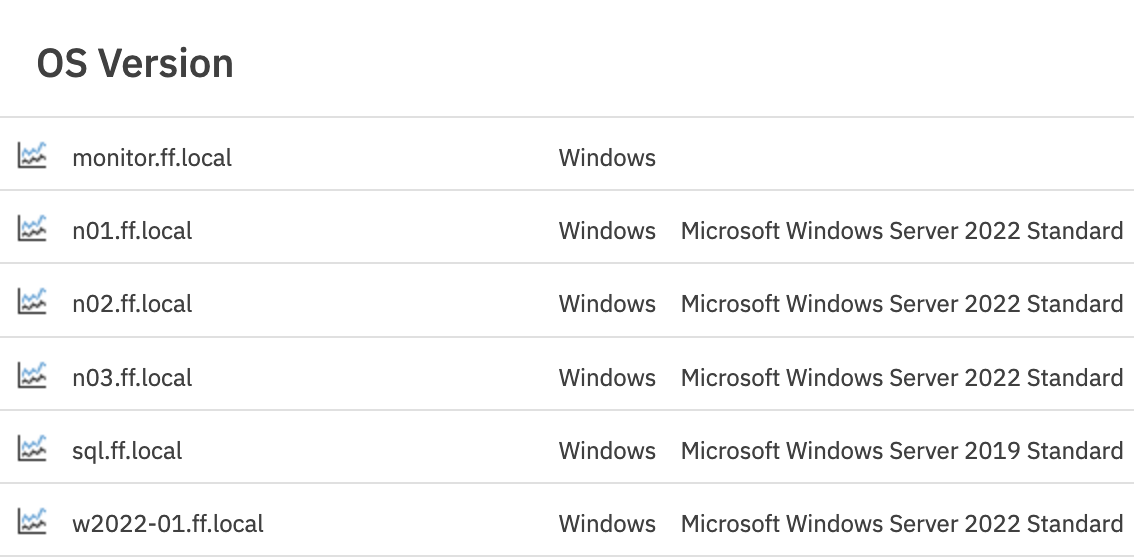 Table of OS Types and Versions
Remote Node Monitoring Updates
A feature that's always been available on your local sites is now available remotely as well. The gear icon on each event monitor that spins while the event monitor runs and stops when it's done updating is now available for event monitors watching your remote nodes. Now, the gear will spin while your remote nodes are being checked and finish when they're done, with some lag, of course, as remote nodes call home by default every 15 seconds.
 Event Monitor Gear Icon
Other Updates for v2023.6
- We improved the look and legibility of graphs and other dashboard components in dark mode.
- We fixed an issue with selecting multiple device groups in some report elements.
- We modernized status graphs throughout the interface and made it possible to delete them in certain cases when the user couldn't before.
- We added new options to the Event Monitor Results dashboard panel that let you resize the text to better fit large displays.
- We significantly reduced the time it takes for a remote node to transition to its failover server.
- We fixed an issue where you could only send one test email notification and now you can send as many as you want.
Update Today
Make sure you log in and update today so you can keep taking advantage of the latest FrameFlow features and fixes. Contact Support if you have any questions or issues. Our change log is updated with each new release, so check it out for a full list of all recent changes.
Try FrameFlow Now
If you aren't already a FrameFlow user, there's never been a better time to take it for a spin. Download our trial now to try FrameFlow commitment-free for 30 days!