What’s New in FrameFlow v2021.15
Learn What has Changed, What's Stayed the Same, and What's Coming Next
Changes for FrameFlow v2021.15
We recently released FrameFlow v2021.15 which includes improvements to event monitors and navigation and even includes a brand new event monitor. This blog post will highlight each major change and detail a bit about each one. You can view a list of all changes on our website's change log.
New: Installation Health Event Monitor
Have you ever wondered if FrameFlow can use FrameFlow to monitor FrameFlow? That's the premise of the Installation Health Event Monitor. Just like the System Health Event Monitor, the Installation Health Event Monitor gathers CPU, disk, bandwidth, and memory data, but what sets this event monitor apart are its other uses. It can monitor aspects of your monitoring configuration like monitoring queue length, remote node self-updates, and more.
 Installation Health Monitor Settings
We encourage all our users to make use of this new feature. Monitoring your FrameFlow server itself adds another layer of protection against major monitoring problems. A tutorial for this new monitor will be coming to the Features page soon!
Breadcrumb Navigation
Another useful new feature of FrameFlow v2021.15 is breadcrumb navigation. Breadcrumb navigation is used to retrace your steps within your FrameFlow installation much more easily. Use it in your hierarchy of groups of network devices or event monitors to easily navigate back through the groups.
 Breadcrumb Navigation
Each of the group titles above is clickable, allowing you to go back one or more levels in the hierarchy instead of having to start over from scratch. This adds more ease to the way you navigate through FrameFlow.
Event Monitor Improvements
Existing features have also gotten a touch-up in v2021.15, including the SNMP and Performance Counter Event Monitors. In each of these event monitors' settings, under "Comparison", the only option was "Send an alert if the value is [above/below] the specified value". For many monitoring cases, this comparison didn't make a lot of sense. The new option, instead, allows you to enter a range of values that will trigger an alert. This allows you to receive alerts about any values discovered to be outside/inside the designated range, allowing either case to trigger alerts instead of just one.
The Windows Event Log Event Monitor also received an update. We added new filtering options for success, verbose, and critical event types. Previously, the only options available were the rest that you see below. Now you can further filter your event logs and receive only the information that you require.
 New Event Level Option
View our change log for a complete list of event monitor updates, additions, and changes.
Maintenance Windows and System Restarts
In previous releases, some users with System Restart Event Monitors would receive multiple reboot notifications when maintenance window periods ended. This was because the System Restart Event Monitor gathers data from the recent past as well as the present. To combat this, we added a new option to our System Restart Event Monitor. The option allows you to single out reboots that occur during maintenance windows and silence them.
 Option to Ignore Maintenance Window Reboots
New Network Diagram Option
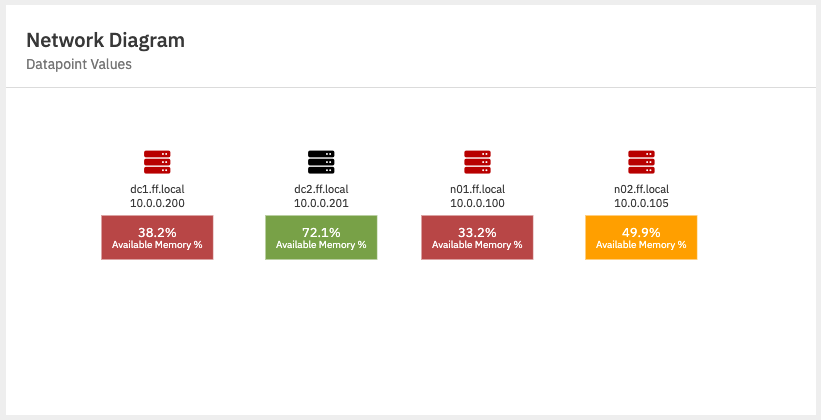
Ahead of our anticipated Dashboards tutorial series, we added a new network diagram feature that lets you add specific data points to your diagrams. Previously, adding a data point meant trying to overlay a data point value panel on top of your existing network diagram. This method had a lot of problems with navigability and visual appeal, so we added an option to add data points directly to a network diagram.
 Data Point Network Diagram Feature
Tickets
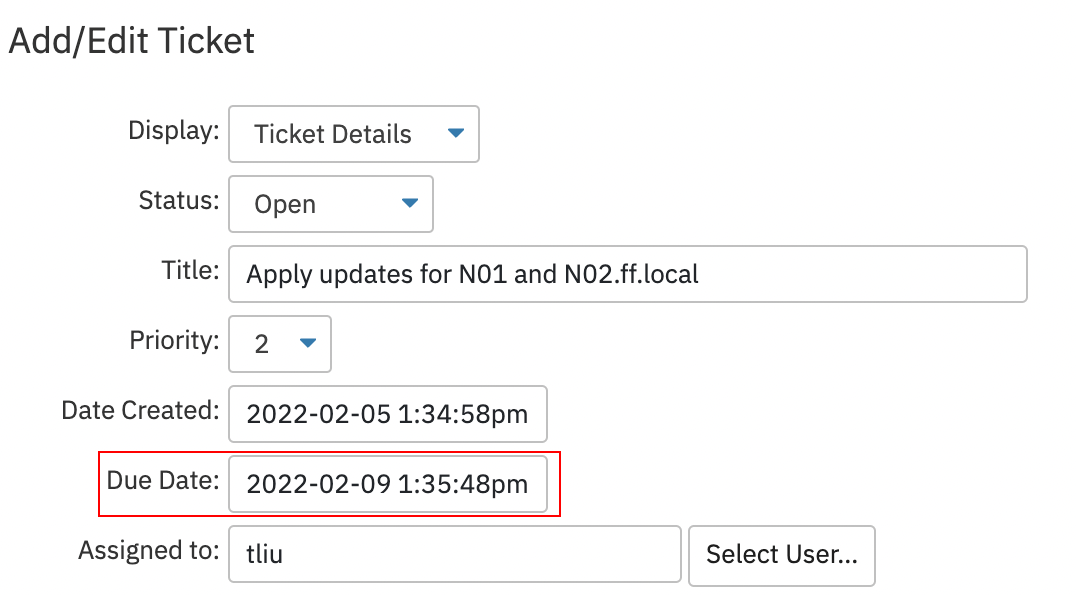
We've also updated FrameFlow's Tickets function with the option to include a due date for whatever action was assigned.
 New Due Date Field
Available Now
FrameFlow v2021.15 is available now! Make sure to log in and upgrade at your earliest convenience to take advantage of our newest work. As always, don't hesitate to let us know what you think of the new update or to report a bug.
Try FrameFlow Now
Are you new to FrameFlow? Download now to take it for a spin for free for 30 days and start taking advantage of its enterprise IT monitoring features.