Increased Monitoring Throughput in v2017.1
Monitor More Systems Using Fewer Resources
Monitor More Systems Using Fewer Resources
Since the beginning we’ve focused on monitoring performance, tuning our monitoring engine and our data storage technology to eek out the best gains possible, allowing you to monitor more systems with fewer resources. It’s those efforts that have helped us to deploy massive installs monitoring thousands of systems from a single FrameFlow installation.
Today we’re happy to show you how, in v2017.1, we’ve achieved some impressive improvements. Let’s take a look.
FrameFlow Helper Service Offloads Some Monitoring Tasks
Some of you might have noticed that recently, installations deploy a second FrameFlow service called the "Helper Service." It had some growing pains, but we persevered with it and the work has paid off. The helper service offloads some monitoring tasks from the main FrameFlow service and uses highly optimized techniques to do more work in less time and with fewer resources.
Recently we set out to measure the gains we had achieved so far and the results were impressive enough that we wanted to share them with you.
Test #1: Single Core VM, 3.3Ghz and 1G of RAM
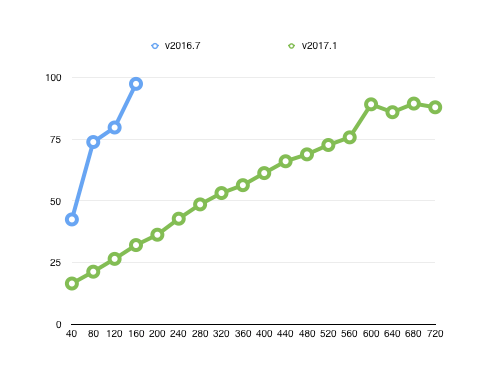
For our first test, we used a virtual machine with 1 core running at 3.3Ghz and 1G of RAM. We ran one test using v2016.7, our current official release, and a second test using an internal build of v2017.1. Each one was configured with ping event monitors checking devices every 5 seconds and while the test ran we added devices in blocks of 40. The result was the following graph:

The older release (blue line) started out high with CPU usage around 45%, then topped out near 100% when it was concurrently monitoring 160 devices on 5-second intervals. When we pushed it beyond 160 devices, everything kept running but monitoring times slipped beyond the 5-second schedule. If those numbers seem small, keep in mind that they represent almost 2000 monitoring actions per minute running from a VM with just 1 core.
By comparison, our 2017.1 internal build blew the doors off. At 160 nodes it was sitting around 32% CPU usage, which was far less than the older build started off with, and it continued to scale beautifully. At 560 nodes it was still sitting at just 75% CPU. That’s 1300 monitoring operations per second (or more than 24 million ops per day) still on a VM with just one CPU.
You might notice that the 2016.7 line peaks at 100% CPU, but the 2017.1 line levels out around 90%. That’s an intentional design decision that we made to make sure everything continues to run smoothly. Our algorithms put priority on monitoring but when resources start to become scarce, the system keeps a reserve to make sure the user interface remains responsive and other tasks like report building have their own time to complete.
Test #2: Quad-Core VM, 3.3Ghz and 1G of RAM
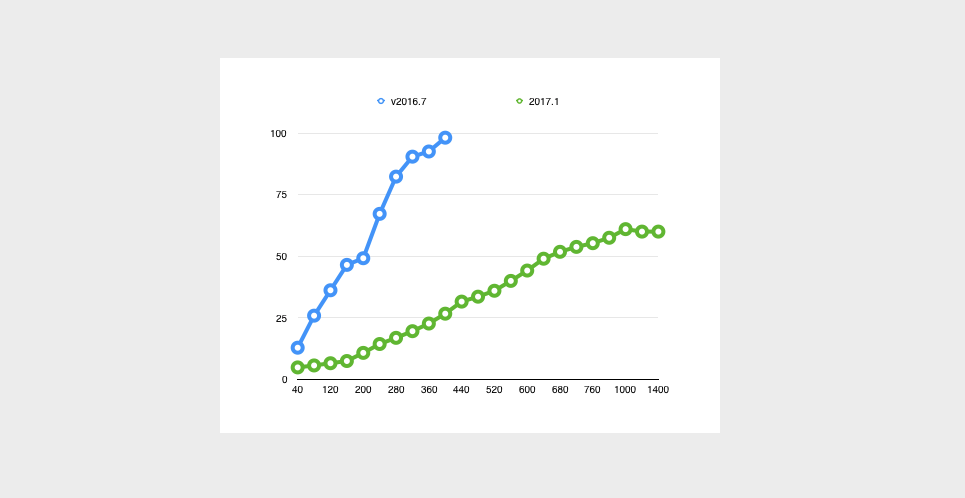
To scale things up, we moved up to a quad-core configuration while leaving everything else the same. Here are the results:

In this test 2016.7 topped out around 360 nodes before hitting 100% CPU. By comparison, 2017.1 reached over 1000 nodes before leveling out at about 65% CPU. That’s 2400 monitoring ops per second or over 43 million in a 24-hour period.
As you can see from the graph, it looks like 2017.1 has room to grow. We’re studying why it topped out at 65% instead of pushing closer to 90%. At the moment it looks like the algorithm that is holding the CPU reserve needs a bit more tuning. We’re still several weeks away from an official 2017.1 release though, and we’re bound to squeeze out some more gains before this version goes live.