How to Make a System Health Event Monitor Ignore Selected Drives
How to Ignore Certain Drives with the System Health Event Monitor
About FrameFlow's System Health Event Monitor
We often tell our customers that everyone should have a System Health Event Monitor. FrameFlow's System Health Event Monitor watches the most important system health metrics and sends you alerts when rates exceed the thresholds you specify. System health includes memory, bandwidth, ping response time, CPU usage, and disk space. This data is used to populate certain dashboard panels and reports, making it one of the most important event monitors for gathering, organizing, and displaying important information about your devices.
The System Health Event Monitor is a versatile and essential tool, but some users are hesitant to implement it in their monitoring environment because they're worried about notification overload. It's common for some systems to constantly be above the thresholds you set no matter what, like a SQL Server database that purposely consumes 100% of available memory. What should you do in cases like this so you don't get inundated with alerts about a condition that's actually fine?
Ignoring Selected Network Devices
Choosing to simply not include devices that have one or two system health metrics that you don't want to monitor means you'll be missing out on gathering all other data and receiving alerts regarding that device. That's why each option in the System Health Event Monitor has a sub-option to ignore selected network devices. In each of these places, you can enter a comma-separated list of network devices that you don't want to be monitored by this metric.
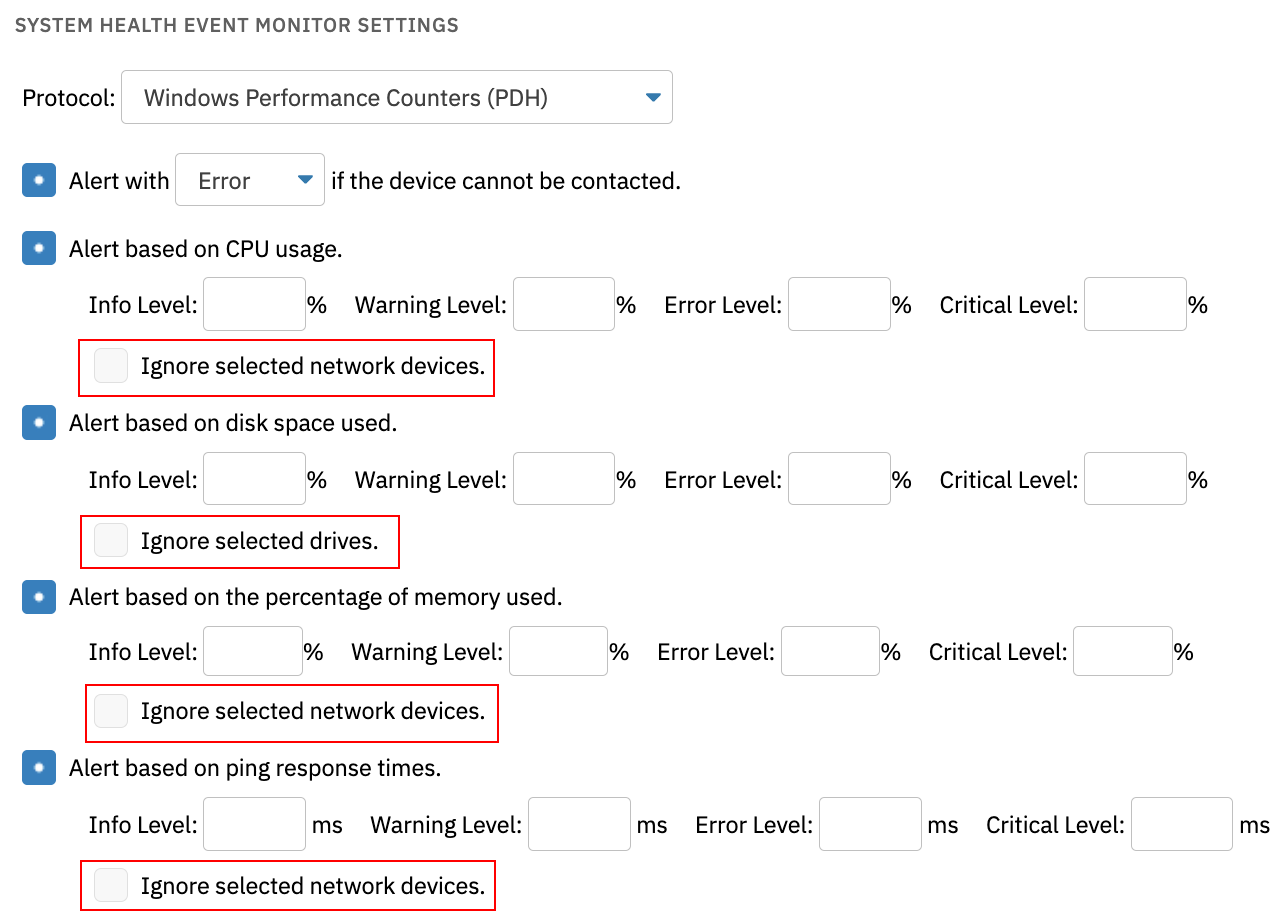 "Ignore" Options in System Health Event Monitor Settings
To use our earlier example, enter the name of your SQL Server Database in the "Ignore Selected Network Devices" field next to the memory option of your System Health monitor. This way, all other connected network devices will be monitored according to the thresholds you enter in the memory settings of the event monitor. Additionally, your SQL Server database will be monitored according to all the other settings in your System Health Event Monitor, but you won't be constantly receiving critical notifications about its memory usage.
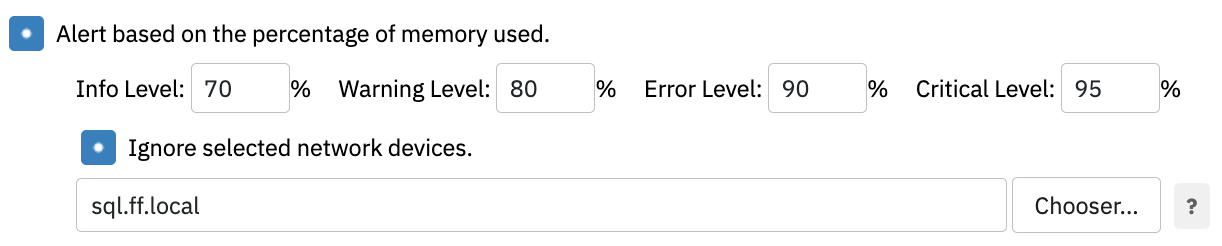 "Ignore Selected Network Devices" Option
Ignoring Selected Drives
For the disk usage metric, things work a little bit differently, as one network device can have multiple disk drives. For this case, we have a special syntax to single out certain drives to ignore. Enter the drives to ignore using the following format: "deviceName(C)" (without the quotes). You can use the * character to match multiple devices or drives. For example, use "devicename(*)" to ignore all drives on a device. Use "x*(D)" to ignore the D: drive on all devices whose names start with x. To specify multiple drives to ignore, separate them with commas, for example, "device1(G), device2(F)".
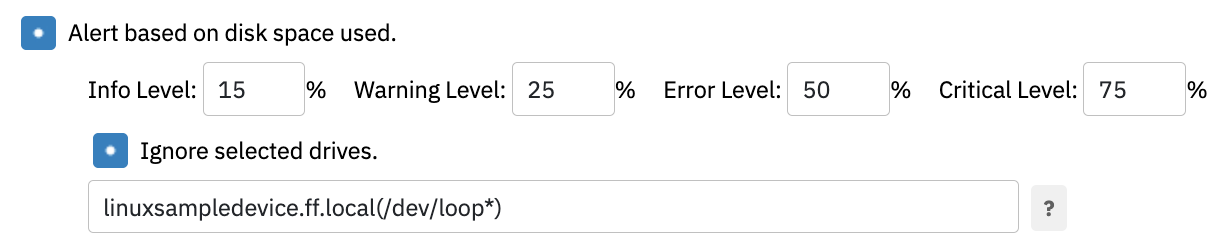 Linux Ignore Example
In the above example, the user wanted to ignore certain classes of disks on their Linux-based network device. This user had several different drives stored under a /dev/ folder in the format "loop1", "loop2", "loop3" etc. The syntax above will ignore all file systems with the prefix "/dev/loop".
Let's go over a Windows-based example, too. In the below scenario, all F drives in "win01.ff.local" will not be checked.
 Windows Ignore Example
This syntax is super customizable, allowing you to pick single drives to ignore or ignore an entire subsection of your drives. Drives or devices that you enter into the System Health Event Monitor's "ignore" fields will still have their data gathered for graphs, data points, and dashboard panels. The "ignore" feature simply makes sure you don't get alerts about ignored devices. The status for devices and drives that are ignored will always be "Success".
Summary
Now that you know how to ignore selected network devices, are you more likely to create and use a System Health Event Monitor? If so, here's a link to a tutorial on system health to help you get started. Make sure to keep an eye on our blog and subscribe to our newsletter to keep up to date on the latest tips and tricks from FrameFlow!
Are you new to FrameFlow? Download now to take it for a spin for free for 30 days and start taking advantage of its enterprise IT monitoring features.