Device Types
Learn About FrameFlow's Network Device Types and How to Use Them
About Device Types
"Device Type" is a dropdown option you can find in the Settings section for any network device. By default, any network device without a device type has the standard set of tabs: Status, History, Graphs, Tickets, and Settings. A device with the type set as Windows, for example, will also have Services, Processes, Event Logs, and Updates tabs to work with. These extra tabs add functionality that's specific to the type of device you're working with. This tutorial will show you how to add these extra tabs to your network devices by setting their device types.
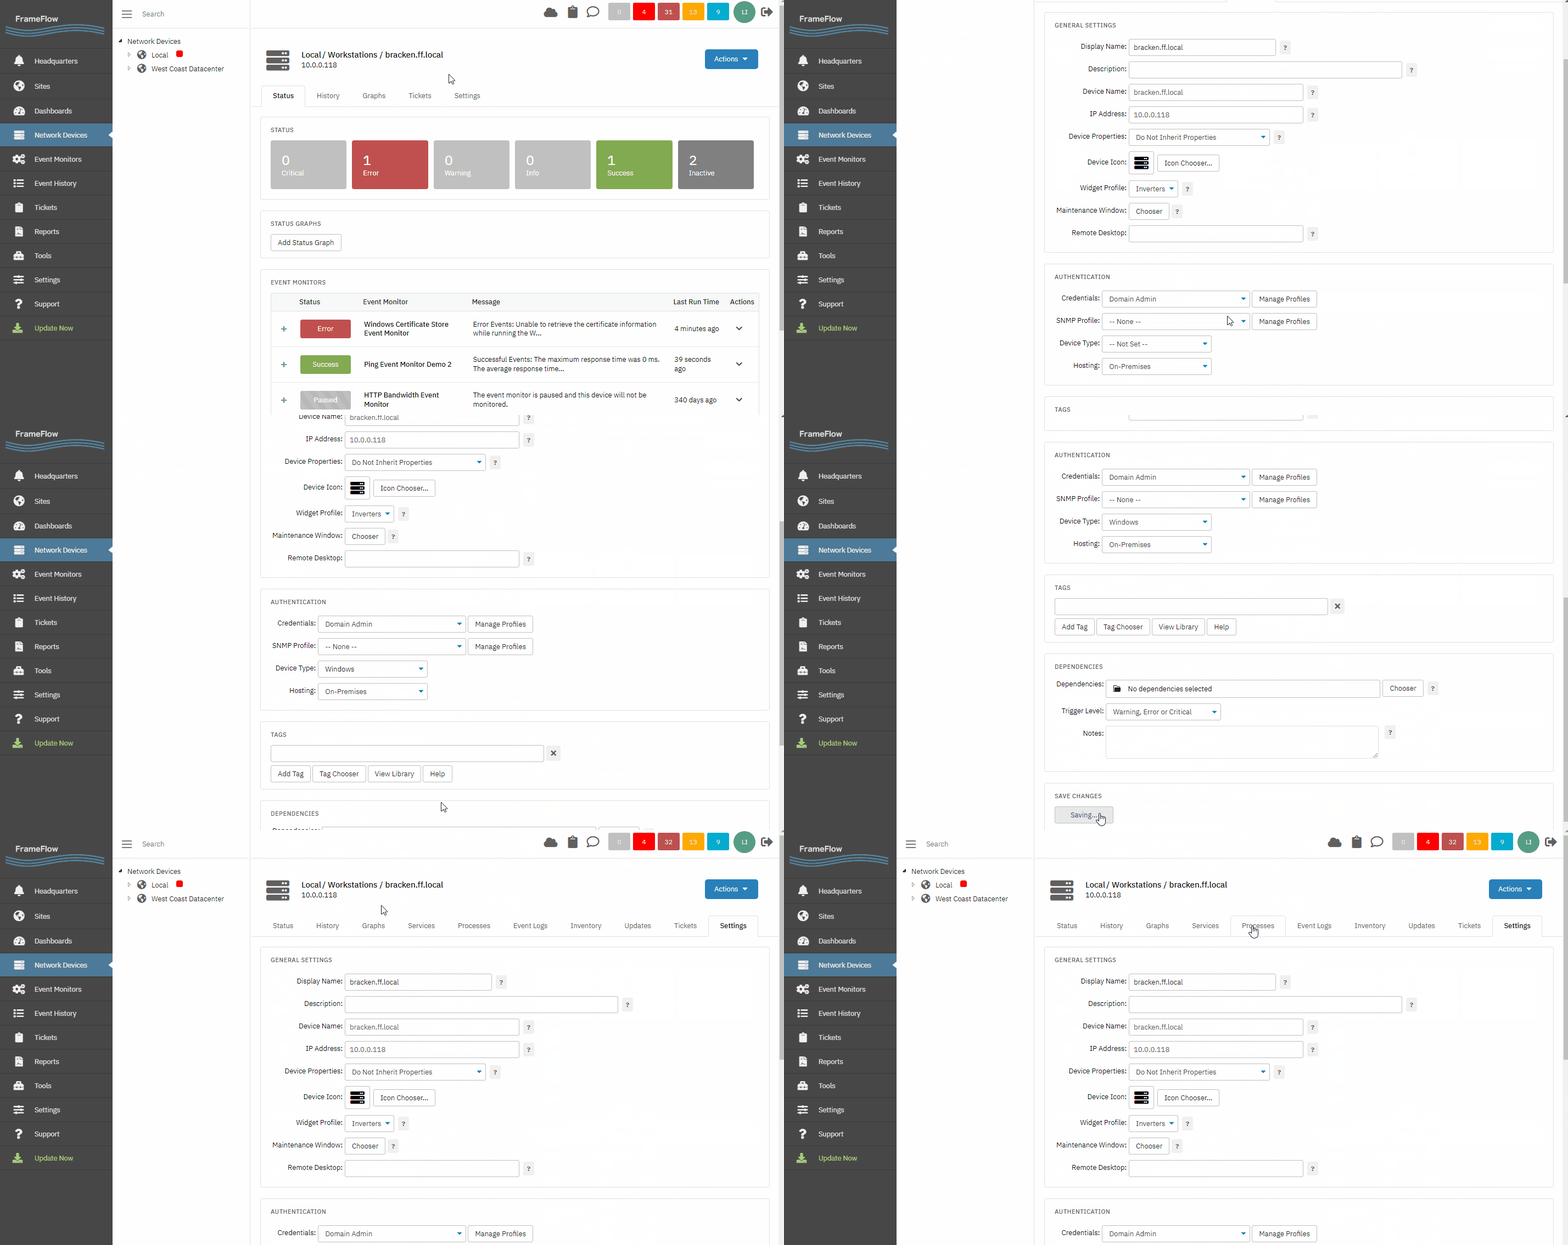
Choose a Windows-based network device and visit its Settings section. Scroll down to the Authentication section where you'll find a dropdown menu called "Device Type". Select the Windows type, input any missing credentials info, then click "Save Changes" in the Actions menu. The new device-specific tabs will appear right away, but you have to populate them by manually refreshing them in the Actions menu. After doing this, you'll be able to see the contents of your new tabs. Your Windows device, as mentioned in the intro, will now have Services, Processes, Event Logs, and Updates tabs.
 Setting Windows Device Type
You can interact with the Processes and Services tabs of your network devices by checking boxes next to each process or service and using the Actions menu to stop, start, or restart them. You can also retrieve event logs for Windows-based devices within the network device's FrameFlow interface. The Inventory tab will be populated with information from your Windows Inventory Event Monitors. If you don't already have one, start by adding one in the Event Monitors section of your FrameFlow installation.
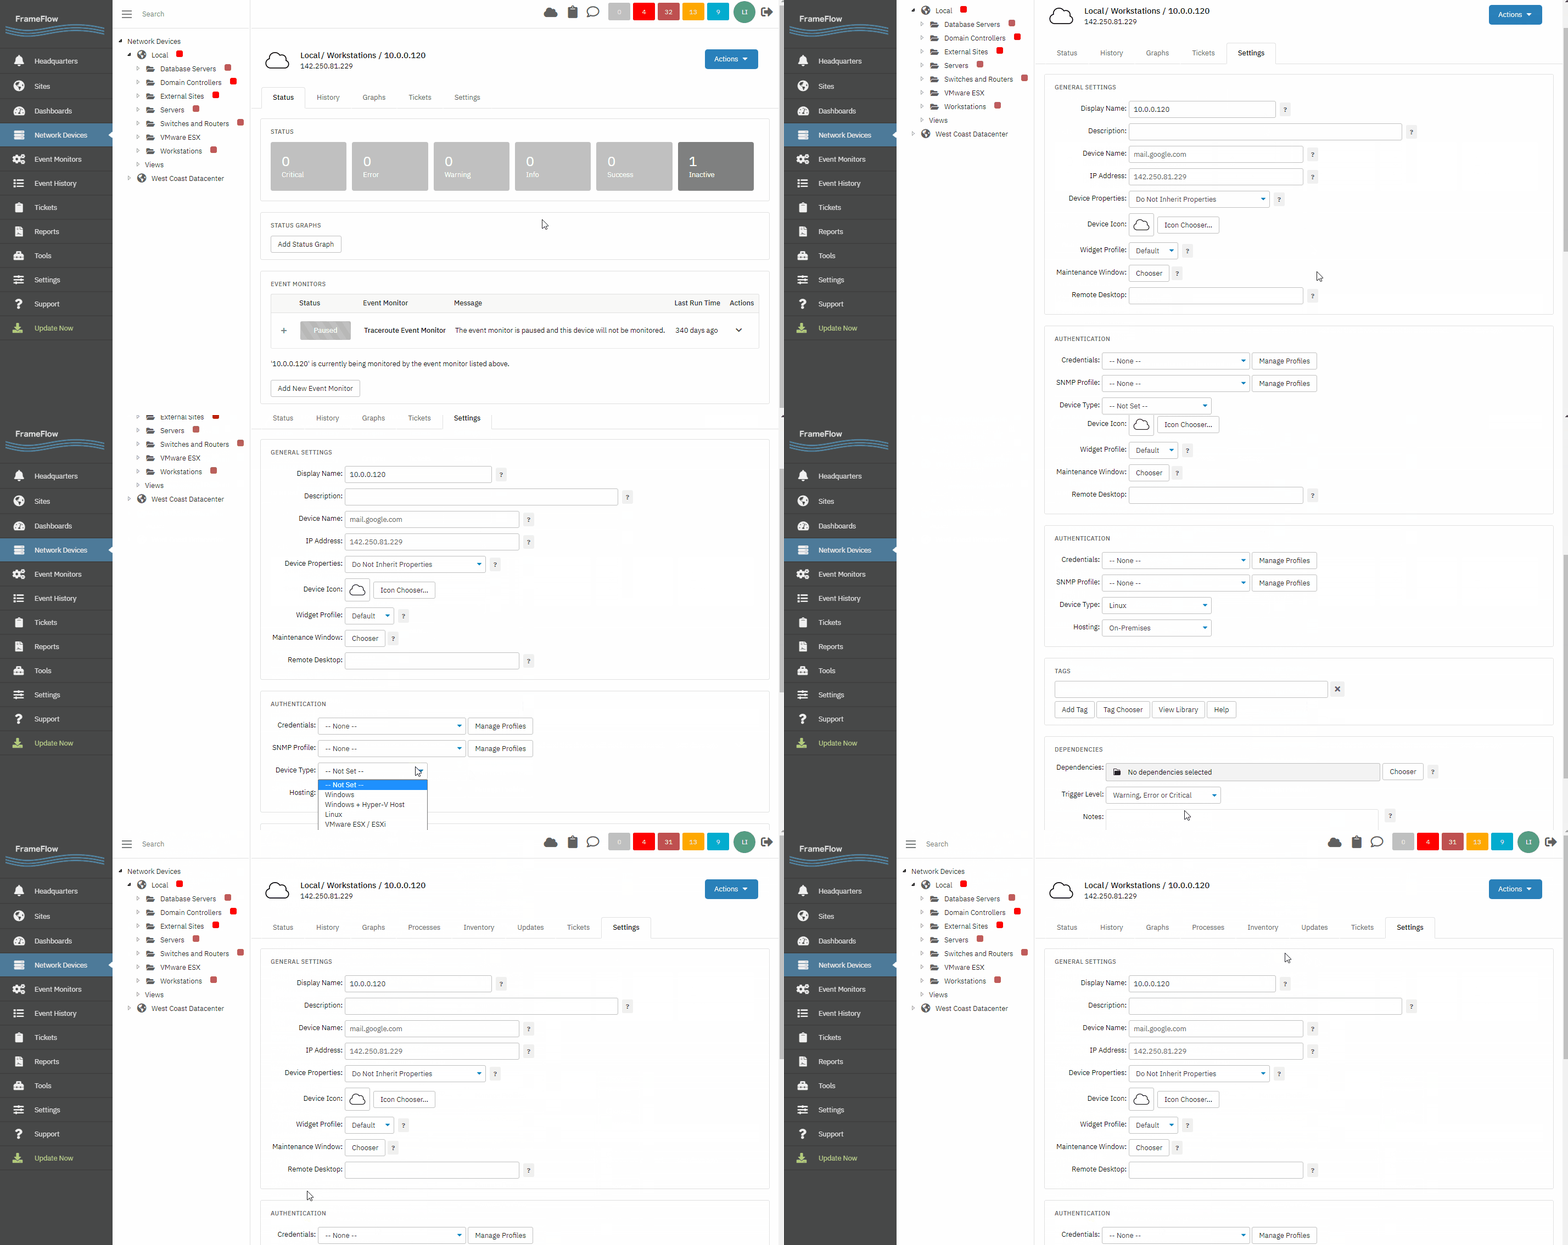
Go to the Settings section of one of your Linux-based devices and change its device type to Linux. After clicking "Save Changes" and refreshing, your Linux device will have Processes, Inventory, and Updates tabs filled with useful and interactive information.
 Setting Linux Device Type
The Inventory tab that's now available will be populated with information collected by your Linux Inventory Event Monitors. If you don't already have a Linux Inventory Event Monitor, you can add one in the Event Monitors section of your FrameFlow interface.
Setting the VMware ESx device type reveals a VMs tab where you can view the list of virtual machines on your network device. When receiving alerts about your device, you can use this tab to quickly view the affected virtual machines.
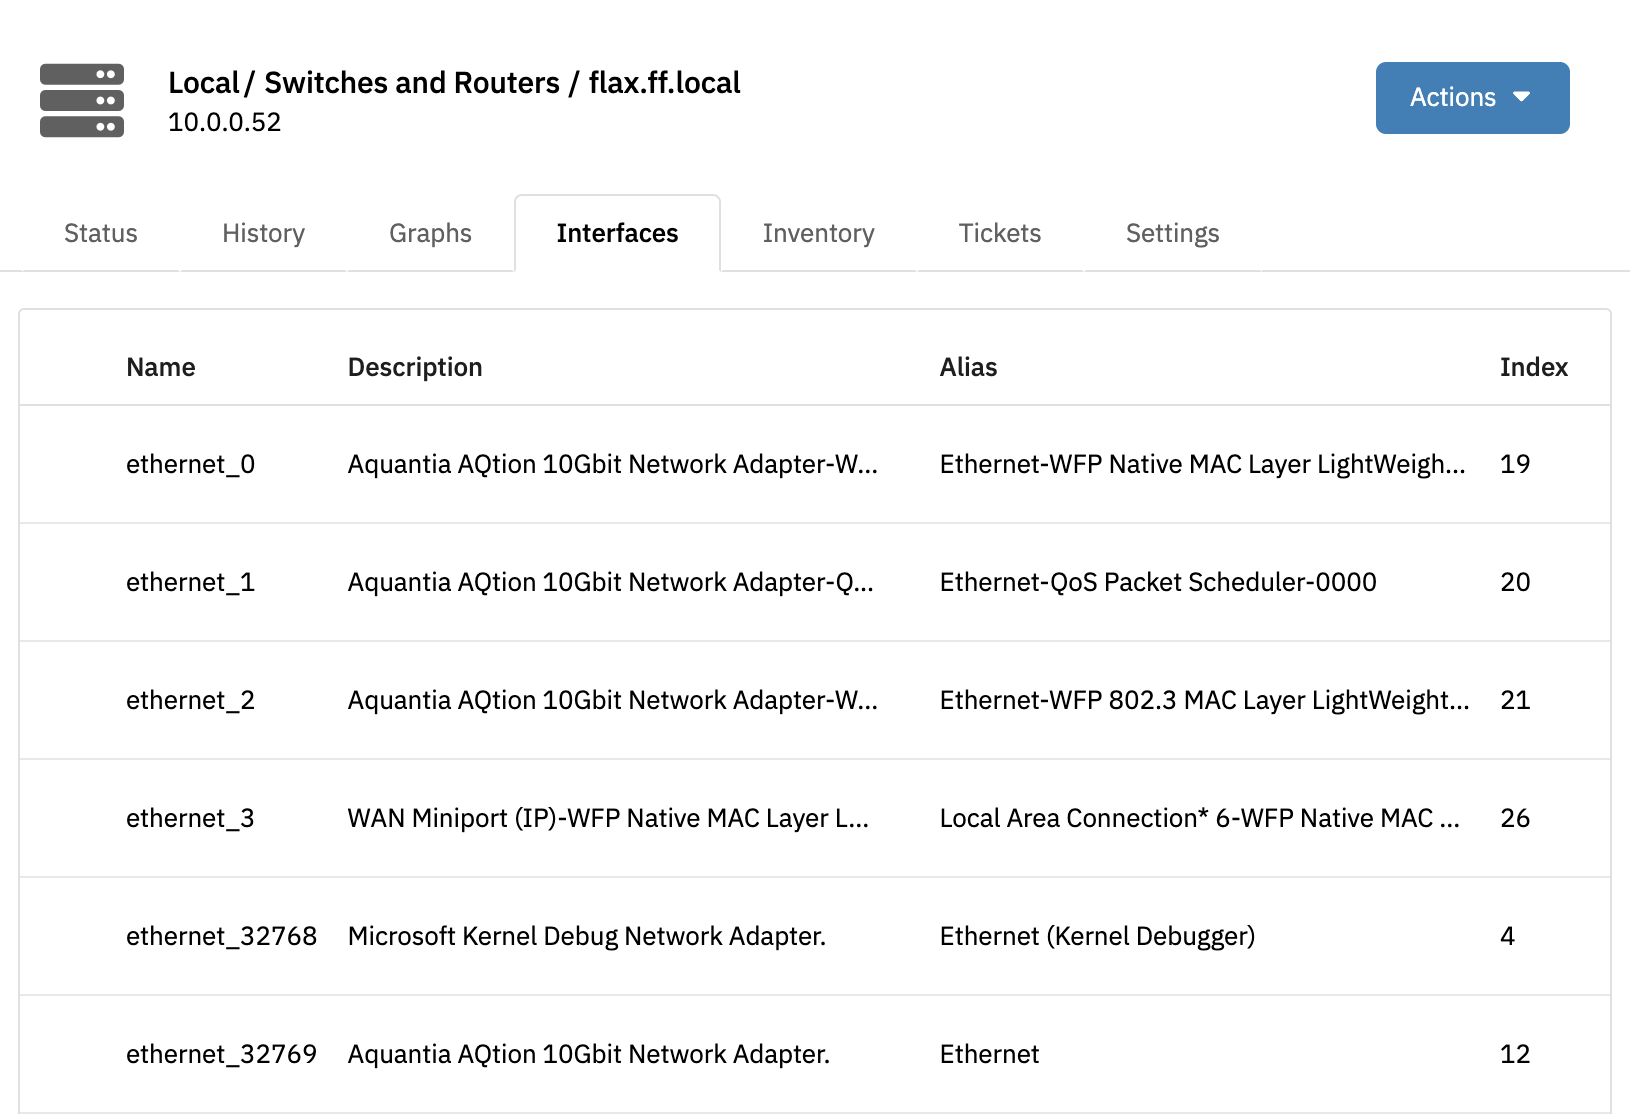
Devices labeled with this device type will now have Interfaces and Inventory tabs. From this tab, you can refresh the list of interfaces, choose the columns that will and won't appear in the list, and rearrange the order of the columns you do want. You can also mark interfaces as favorites or as ignored using the stars in the first column. Click once to set the interface as a favorite and twice to ignore.
To remove this status, click one more time to set the interface back to neutral. This status controls how your SNMP Event Monitors will handle each interface. Each SNMP Event Monitor has the option to monitor only those interfaces that are marked as favorites to cut down on the amount of data reported on by the event monitor, so choose wisely!
 Switch/Router Device Type
The Inventory tab that's now available will be populated with information collected by your SNMP Inventory Event Monitors. If you don't already have an SNMP Inventory Event Monitor, you can add one in the Event Monitors section of your FrameFlow interface.
This device type gives you all the Windows-based tab information from the Windows device type, plus a VMs tab that works the same way as the VMs tab for VMware devices.
 Switch/Router Device Type
Try FrameFlow Now
New to FrameFlow? Give us a try for 30 days for free and start taking advantage of our features risk-free. All our features are available during evaluation, including our customizable dashboards that let you interpret the status of your critical systems at a glance, 24/7.