Part 2: Server Monitoring Dashboards
Learn About the Features and Functionality of FrameFlow Dashboards
Interactive FrameFlow Dashboards
FrameFlow's Dashboards section is home to an array of helpful dashboard panels that we've decided to highlight in a new series of tutorials. In this blog post, we'll be going over the second set of panels, so don't forget to check out our first post to read all about the first few panels.
System Health Panel
FrameFlow's System Health dashboard panel displays system health metrics on your dashboards for easy access. It reports real-time metrics like disk space, bandwidth, CPU, and ping. You can even choose which network devices will be used to gather the data and which ones will be ignored, allowing you to display only the most relevant metrics. Learn how to create one by viewing our System Health Dashboard Panel tutorial!
 System Health Panel with Multiple Selected Metrics
Event Monitor and Network Device List Panels
The Network Device List panel and the Event Monitor List panel provide ordered lists of items that are in your monitoring configuration. Add them to your existing dashboard to see an up-to-date list of your devices or monitors in order of status. To monitor paused devices, which can all too often end up neglected, you can add a Network Device List panel dedicated only to paused devices. We go over all the settings and applications of these two panels in our Event Monitor and Network Device List Panels tutorial, so make sure to take a look.
 Network Device List of Paused Devices
Sector Graph Panel
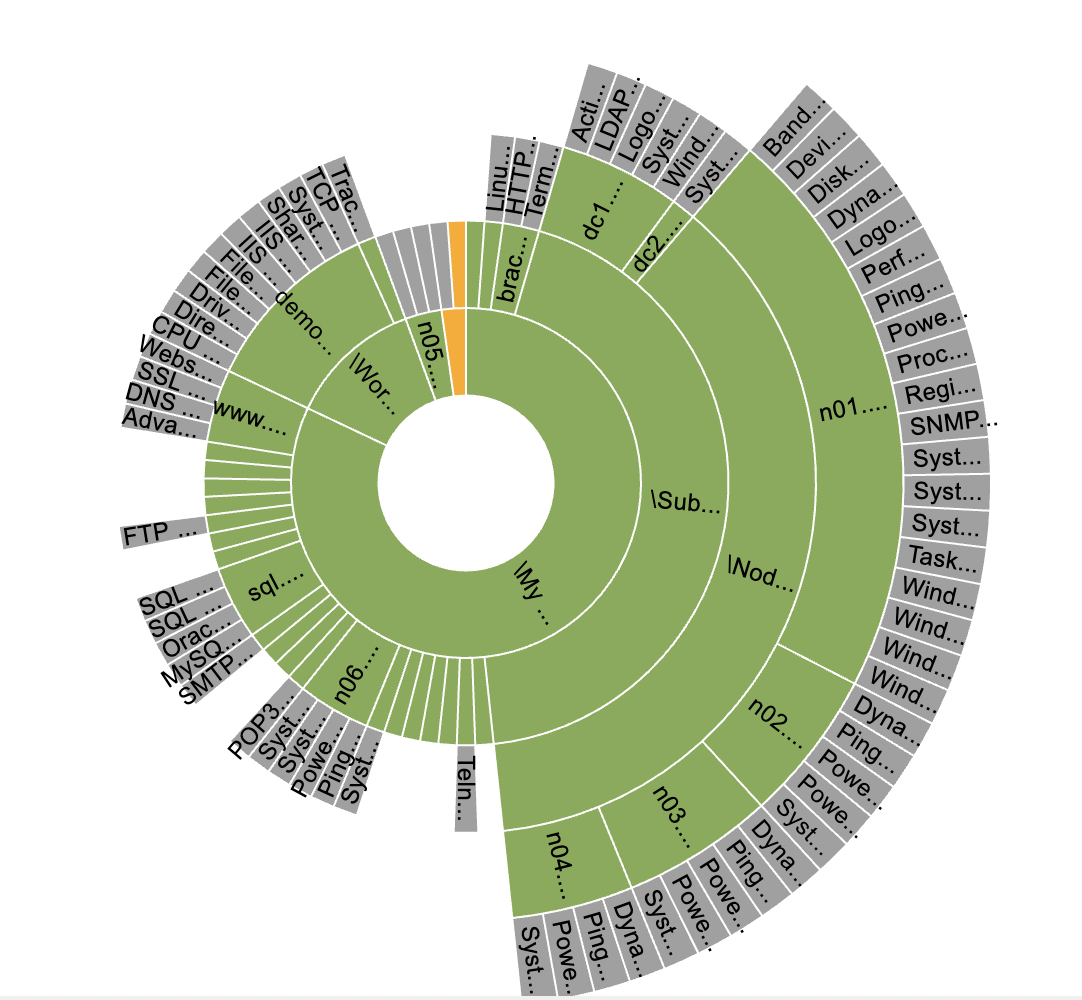
FrameFlow's sector graphs are powerful tools that offer a bird's eye view of all operations. The center wheel in a sector graph represents the topmost group in your monitoring configuration, while the outer concentric rings represent the rest of the hierarchy. Each segment represents a network device, while the outer leaf nodes are each event monitor in your configuration. Hovering over a network device connected to a System Health Event Monitor will show the system health info for that device. Read up on these and other sector graph features in our Sector Graphs tutorial.
 Sector Graph Example
Event Monitor Queue Panel
The Event Monitor Queue panel lets you take a peek under the hood at the checks your event monitors are performing at any given moment. It shows the background processes that are vital to FrameFlow's monitoring operations so you can see what your event monitors are up to and verify that things are running smoothly. Checks that are completed drop off the list in real-time, so this dashboard panel gives you a chance to see if any of these checks are taking longer than usual to complete. This can help you identify and tackle the root issue faster. Read more about our Event Monitor Queue panel and much more on the Features page of our website.
 Event Monitor Queue Panel
Try FrameFlow Now
If you're new to FrameFlow, take it for a spin for free for 30 days and start taking advantage of our enterprise IT monitoring features. Our dashboard features are just the tip of the iceberg, so make sure to download a free trial below to learn more about what we can accomplish together.