VMware Host Health Event Monitor Reference Guide
VMware Host Health Event Monitor
Monitors metrics on VMware hosts.
Overview
The VMware Host Health Event Monitor keeps track of various metrics and performance values for your VMware hosts.
Use Cases
- Monitoring overall VMware host health
- Making sure adequate disk space and memory is available on your VMware hosts
- Monitoring CPU, bandwidth, and ping response time for VMware hosts
Monitoring Options
This event monitor provides the following options:
Alert With [Info/Warning/Error/Critical] if the Device Cannot Be Contacted
Use this option to get alerts if FrameFlow could not contact the selected device.
Alert based on CPU usage
Use this option to get alerts when CPU usage exceeds the thresholds that you specify.
Alert if the directory contains [more than / less than] a specified number of files
Use this option to set alerting thresholds based on the number of files found in the directory.
Alert based on disk space used
Use this option to get alerts about systems whose disk or partition space is running low. In the option to ignore specified drives, use the following format: "deviceName(C)" (without the quotes). You can use the * character to match multiple devices or drives. For example, use "devicename(*)" to ignore all drives on a device. Use "x*(D)" to ignore the D: drive on all devices whose names start with x. To specify multiple drives to ignore separate them with commas, for example, "device1(G), device2(F)".
Alert based on the percentage of memory used
Use this option to generate alerts based on how much physical memory is in use on each network device.
Alert based on ping response times
Use this option to alert based on the observed ping response time for the device.
Alert based on total bandwidth rate
This option lets you generate alerts based on the total bandwidth rate for the device. This rate is the sum of all incoming and outgoing bandwidth on all interfaces.
Alert based on outgoing bandwidth rate
This option lets you generate alerts based on the combined outgoing bandwidth rate of all interfaces.
Alert based on incoming bandwidth rate
This option lets you generate alerts based on the combined incoming bandwidth rate of all interfaces.
SSH Port Number
The default port number of SSH connections is 22. If your servers are using a non-standard port, you can specify it here.
Authentication and Security
The account that you specify must have view permissions for the VMware REST API or have admin rights.
Protocols
Data Points
This event monitor generates the following data points:
| Data Point | Description |
|---|---|
| Active Memory | The amount of memory that's currently in use. |
| Available Memory | The total memory available. |
| Available Memory % | The percentage of available memory. |
| Average CPU Readiness | The average CPU readiness, in percent. |
| Average Response Time | The average ping response time. |
| CPU Ready Time | The amount of time the CPU spent in a ready state. |
| CPU Usage | The percentage of CPU that's being used. |
| Space Used | The amount of space that's been used already. |
| Total: Incoming | The total incoming bandwidth for your VMware host. |
| Total: Outgoing | The total outgoing bandwidth for your VMWare host. |
| Total Memory | The total memory for your VMware host. |
| Used Memory | The amount of memory used. |
| Used Memory % | The percentage of memory used. |
Tutorial
To view the tutorial for this event monitor, click here.
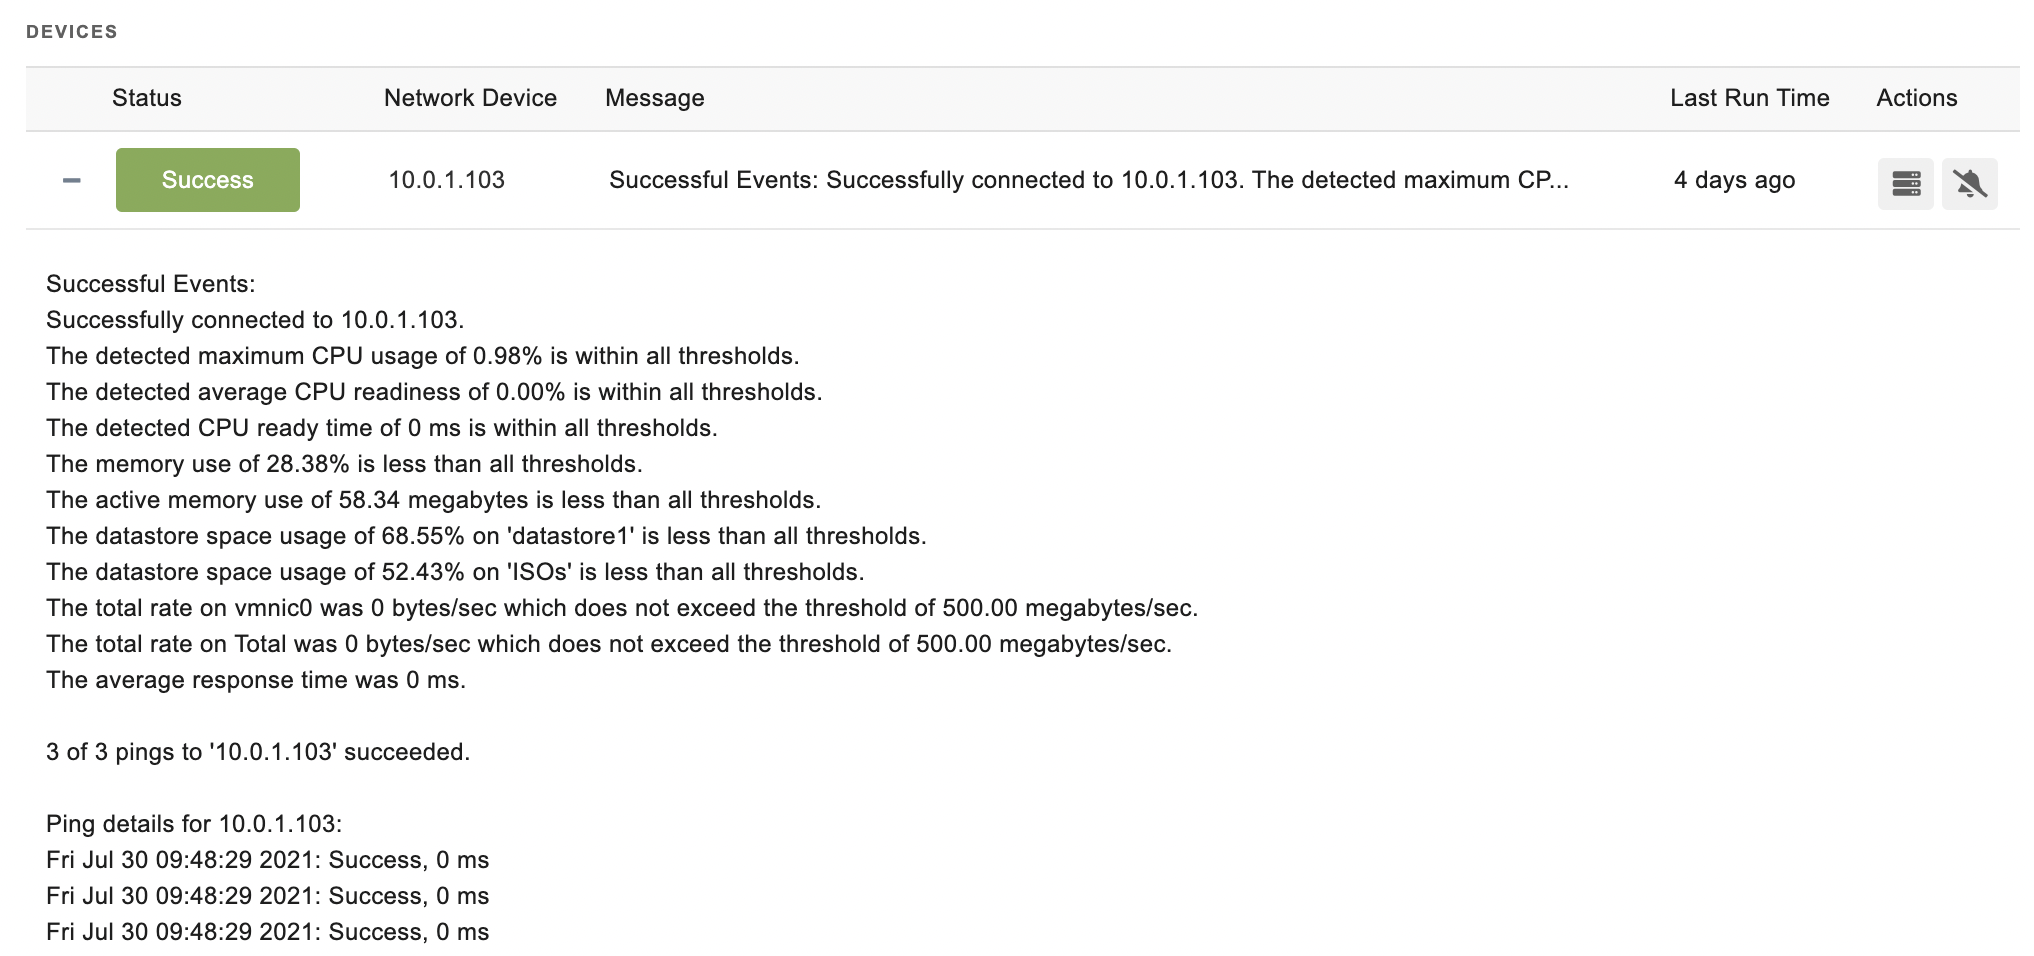
Sample Output
Comments
Add a comment