SQL Server Event Monitor Reference Guide
SQL Server Event Monitor
Makes sure your SQL server databases are up and running.
Overview
The SQL Server Event Monitor is essential for making sure your SQL Server databases are online and operational. This event monitor can run connection tests, check database sizes, check transaction log sizes, and even run SQL statements or stored procedures and verify the results. This event monitor focuses on monitoring the properties of databases and transactions logs. To monitor performance attributes like transactions per second, you can use FrameFlow's SQL Server Performance Event Monitor.
Use Cases
- Making sure transaction logs don't take up too much space
- Running connection tests and SQL queries
- Monitoring database sizes
- Measuring the time it takes to run SQL queries
Monitoring Options
This event monitor provides the following options:
Alert With [Info/Warning/Error/Critical] if the database cannot be contacted
Use this option to get alerts if FrameFlow could not contact the selected database.
Alert if any database is larger than a specified size
A runaway database that is growing rapidly can consume all available space causing chaos for all apps and other databases on the system. Use this option to set thresholds so you will be alerted when any database starts to grow too large.
Alert if the database [database name] is larger than a specified size
Use this option to monitor the size of a selected database and get alerts when it exceeds the thresholds that you define.
Show the size for all databases
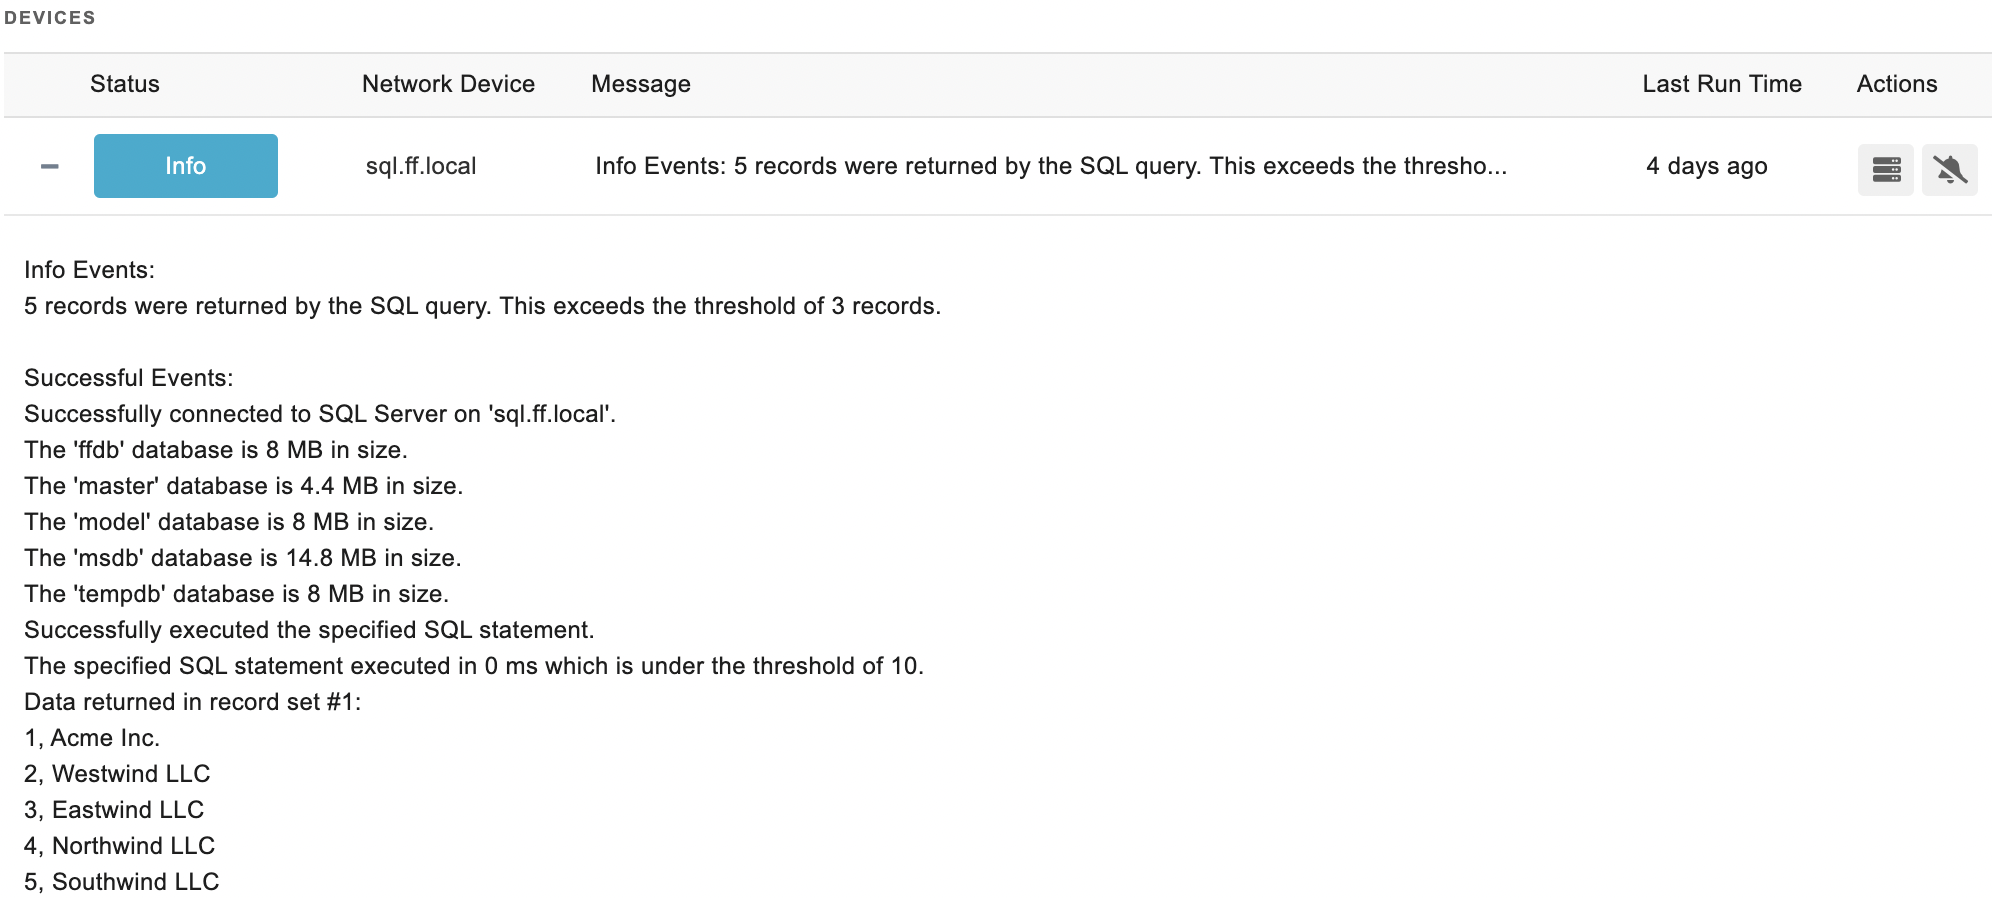
When this option is enabled, all events and alerts will include a list of the detected databases and their current sizes.
Alert if any transaction log is more than a specified amount full
Depending on the recovery model that your databases use, transaction logs can grow rapidly. Use this option to alert based on the percentage full for each transaction log.
Alert if any transaction log is more than a specified size
This option also checks transaction logs sizes but alerts based on absolute sizes instead of percentages full.
Alert if the transaction log for the database [database name] is more than a specified amount full
This option can be used to check the transaction log for a specified database and alert based on its usage as a percentage.
Alert if the transaction log for the database [database name] is larger than a specified size
This option can be used to check the transaction log for a specified database and alert based on its size as an absolute value.
Ignore databases that are offline
With this option selected, the event monitor will not alert about databases that are offline.
Connect using settings for SQL Server availability group listeners and failover cluster instances
With this option selected, the event monitor will use connection settings that are optimized for SQL Server availability group listeners and failover cluster instances. Leave this option off when connecting to standard SQL server instances.
Show the size and percent full for all transaction logs
With this option selected, all alerts and events will include a list of the detected transaction logs and their sizes.
Run a SQL statement
Enable this option if you want to run a SQL statement or stored procedure on the database. The event monitor includes various options to check the results.
Database Name
Specify the name of the database that will be used when the SQL statement is run.
SQL statement to run
Enter the SQL statements that will be run on the database. It's usually a good idea to verify the SQL code in SQL Server itself before pasting it into the SQL Server Event Monitor.
Show the first [#] result rows in all notifications
With this option enabled, the events and alerts generated by the event monitor will include rows returned by the SQL statement.
Alert with [Info/Warning/Error/Critical] if a specified text value is found in the results
Enable this option to tell the event monitor to check the rows returned by the SQL statement. Further options allow you to specify what to search for.
Search for the following text
Enter the text that the event monitor should look for.
Number of rows to check
Tells the event monitor how many result rows it should check for the specified text.
Column number to check
Tells the event monitor in which column it should look for the specified text.
Record set to check
Tells the event monitor in which Record set it should look for the specified text.
Alert if more than a specified number of records are returned
Use this option to alert if the SQL statement returns more than a specified number of rows. You can specify thresholds for warning, error, and critical levels.
Alert if the query takes more than a specified time to complete
Use this option to measure how long it takes for the SQL statement to run and alert if the time takes longer than thresholds that you specify.
Authentication and Security
Select an authentication profile with credentials that have access to the database being monitored.
Protocols
Data Points
This event monitor generates the following data points:
| Data Point | Description |
|---|---|
| Connect Time | The time it took to connect to the server. |
| Customer ID | The ID of the customer. |
| Database Size | The size of the SQL database. |
| Rows Returned | The number of rows in the result. |
| Statement Exec Time | The time it takes to execute the SQL statement. |
| Log Used (%) | The percentage of the log being used |
Tutorial
To view the tutorial for this event monitor, click here.
Sample Output

Comments
Add a comment