ODBC Event Monitor Reference Guide
ODBC Event Monitor
Checks ODBC databases and runs SQL statements. Shows the results retrieved and alerts based on values in the results.
Overview
ODBC (Open Database Connectivity) is a standard interface that Windows systems use to connect to databases. FrameFlow's ODBC event monitor can monitor and run tests for any database that has an ODBC driver available. ODBC drivers are available for Microsoft Access, PostgreSQL, Informix, and many other relational database systems.
Before you get started with the event monitor, make sure to download and install the ODBC driver for your database. FrameFlow monitoring engine is a 64-bit application so make sure to download the 64-bit driver for your database.
FrameFlow has dedicated event monitors for SQL Server, MySQL, and Oracle so if you plan to monitor one of these systems use the associated event monitor instead of the ODBC event monitor.
Use Cases
- Running SQL statements on the ODBC database and checking the result text
- Measuring the time taken to run SQL queries
Monitoring Options
This event monitor provides the following options:
ODBC Data Source Name (DSN)
Before using this event monitor you need to use the ODBC Data Source Administrator to define a System DSN (Data Source Name) for your database. There are multiple DSN types so be sure to create a System DSN. The DSN defines all the details required to connect to the database and assign a name to them. Enter the System DSN name that you defined in this text box.
Alert with Warning/Error/Critical if the ODBC database cannot be contacted
Use this option to get alerts if the event monitor cannot connect to the ODBC database. This could occur if the database is down, the server is powered off, invalid credentials have been supplied, or if network connectivity is lost.
Run a SQL statement
Enable this option if you want to run a SQL statement or stored procedure on the database. The event monitor includes various options to check the results.
SQL statement to run
Enter the SQL statements that will be run on the database. It's usually a good idea to verify the SQL code in your ODBC database itself before pasting it into the ODBC Event Monitor.
Show the first [#] result rows in all notifications
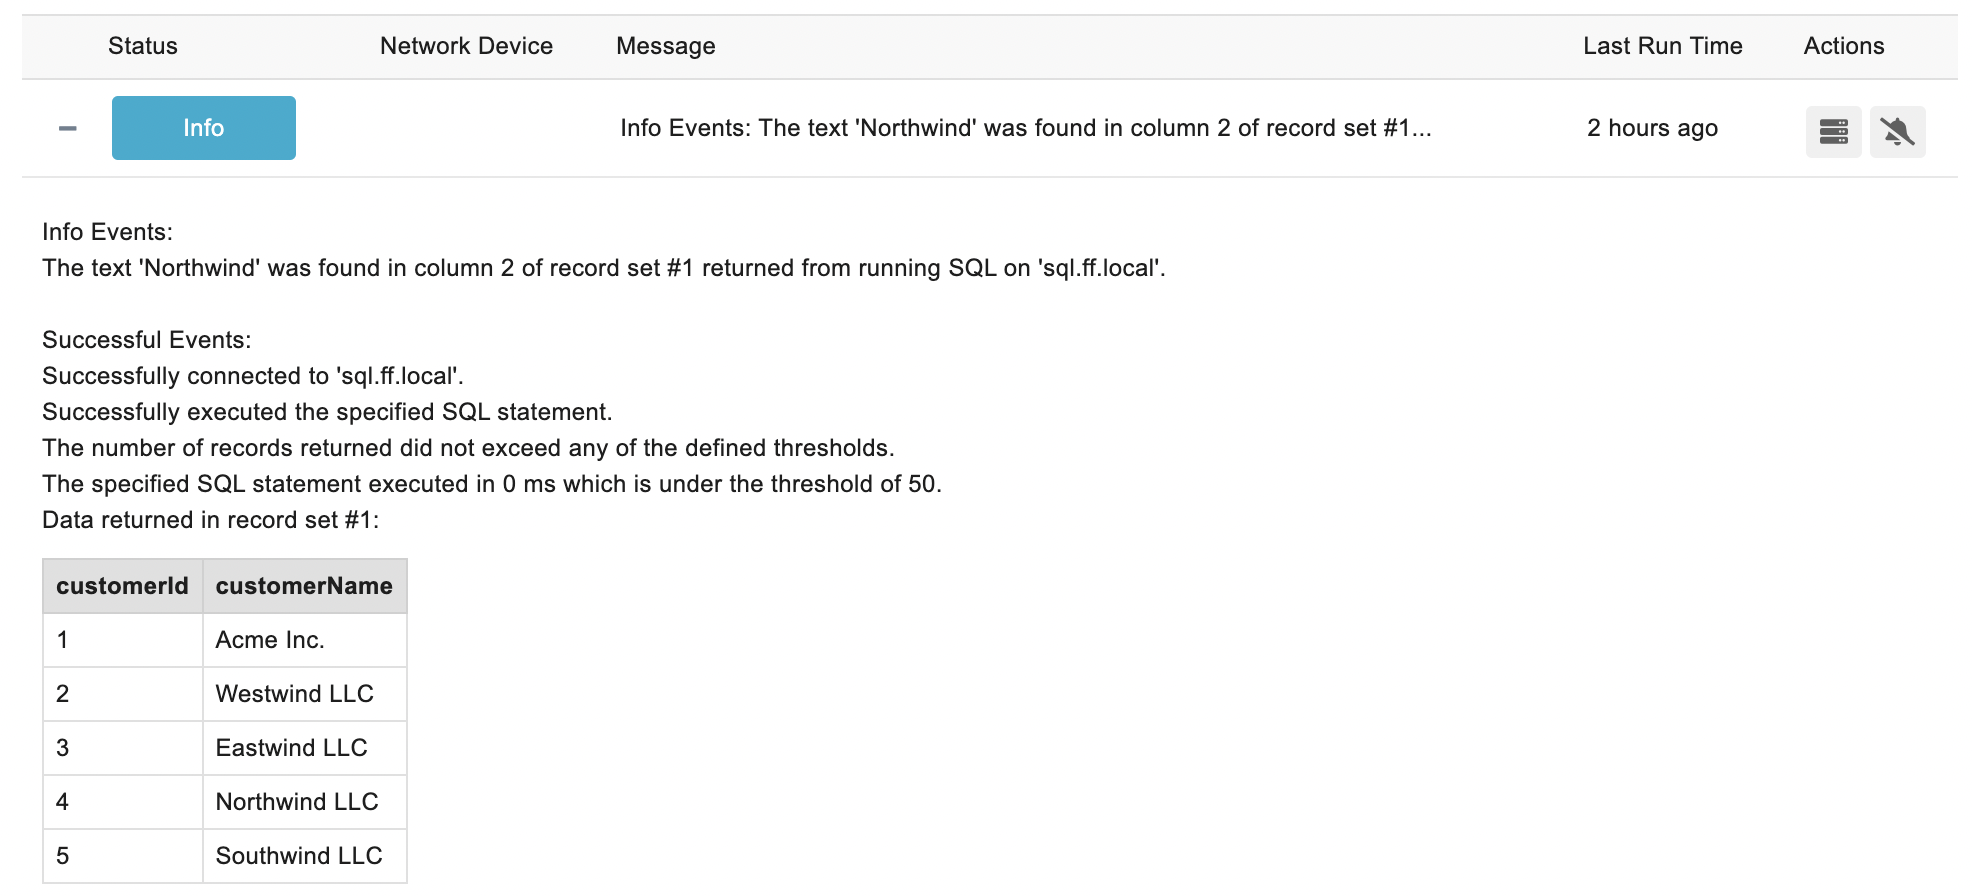
With this option enabled the events and alerts generated by the event monitor will include rows returned by the SQL statement.
Alert with Warning/Error/Critical if a specified text value is found in the results
Enable this option to tell the event monitor to check the rows returned by the SQL statement. Further options allow you to specify what to search for.
Search for the following text
Enter the text that the event monitor should look for.
Number of rows to check
Tells the event monitor how many result rows it should check for the specified text.
Column number to check
Tells the event monitor in which column it should look for the specified text.
Device Association
Select a device that the resulting events and data points will be associated with. This can be a real device that is part of your monitoring configuration or a virtual device like "ODBC1" which only exists to group the results generated by this event monitor. Associating the result with a device lets you use those results in dashboards, reports and other parts of the interface.
Authentication and Security
Select an authentication profile with credentials that have access to the database being monitored.
Protocols
Data Points
This event monitor generates the following data points:
| Data Point | Description |
|---|---|
| Statement Exec Time | The time it takes to run your SQL statement. |
Tutorial
To view the tutorial for this event monitor, click here.
Sample Output

Comments
Add a comment