MySQL Event Monitor Reference Guide
MySQL Event Monitor
Monitors MySQL databases, alerts on database sizes, and runs SQL statements.
Overview
The MySQL Event Monitor is essential for making sure your MySQL databases are online and operational. This event monitor can run connection tests, check database sizes and even run SQL statements or stored procedures and verify the results.
Before you get started with the event monitor, make sure to install the latest MySQL Connector/ODBC driver because the event monitor needs it to connect to your databases. Download and install the 64-bit version from the official MySQL site.
Use Cases
- Keeping track of MySQL database sizes
- Running SQL queries and checking results
- Measuring the time it takes to run SQL queries
Monitoring Options
This event monitor provides the following options:
Driver Version
Enter the exact name of the MySQL ODBC driver that is installed on your FrameFlow system. To find the driver version, use the Windows Control Panel to find the ODBC Datasource Administrator. Select the Drivers tab and locate the MySQL driver. Its name will be similar to "MySQL ODBC 5.3 ANSI Driver" but the version number may change as new releases are made available. If both ANSI and Unicode versions are available, use the ANSI version.
TCP/IP Port Number:
Enter the port number that the MySQL server is listening on. The default port for MySQL is 3306.
Alert with Warning/Error/Critical if the database cannot be contacted
Use this option to get alerts if the event monitor cannot contact the MySQL database server. This could occur if the database is down, the server is powered off, invalid credentials have been supplied, or if network connectivity is lost.
Alert if any database is larger than a specified size
A runaway database that is growing rapidly can consume all available space causing chaos for all apps and other databases on the system. Use this option to set thresholds so you will be alerted when any database starts to grow too large.
Alert if the database [database name] is larger than a specified size
Use this option to monitor the size of a selected database and get alerts when it exceeds the thresholds that you define.
Show the size for all databases
When this option is enabled, all events and alerts will include a list of the detected databases and their current sizes.
Run a SQL statement
Enable this option if you want to run a SQL statement or stored procedure on the database. The event monitor includes various options to check the results.
Database Name
Specify the name of the database that will be used when the SQL statement is run.
SQL statement to run
Enter the SQL statements that will be run on the database. It's usually a good idea to verify the SQL code in MySQL itself before pasting it into the MySQL event monitor.
Alert if the query takes more than a specified time to complete
Use this option to measure how long it takes for the SQL statement to run and alert if the time takes longer than the thresholds that you specify.
Show the first [#] result rows in all notifications
With this option enabled the events and alerts generated by the event monitor will include rows returned by the SQL statement.
Alert with Warning/Error/Critical if a specified text value is found in the results
Enable this option to tell the event monitor to check the rows returned by the SQL statement. Further options allow you to specify what to search for.
Search for the following text
Enter the text that the event monitor should look for.
Number of rows to check
Tells the event monitor how many result rows it should check for the specified text.
Column number to check
Tells the event monitor in which column it should look for the specified text.
Authentication and Security
Select an authentication profile with credentials that have access to the database being monitored.
Protocols
Data Points
This event monitor generates the following data points:
| Data Point | Description |
|---|---|
| Connect Time | The time it takes for the event monitor to connect to MySQL. |
| Database Size | The detected size of the database. |
| Statement Exec Time | The time it took to run your command and receive results. |
Tutorial
To view the tutorial for this event monitor, click here.
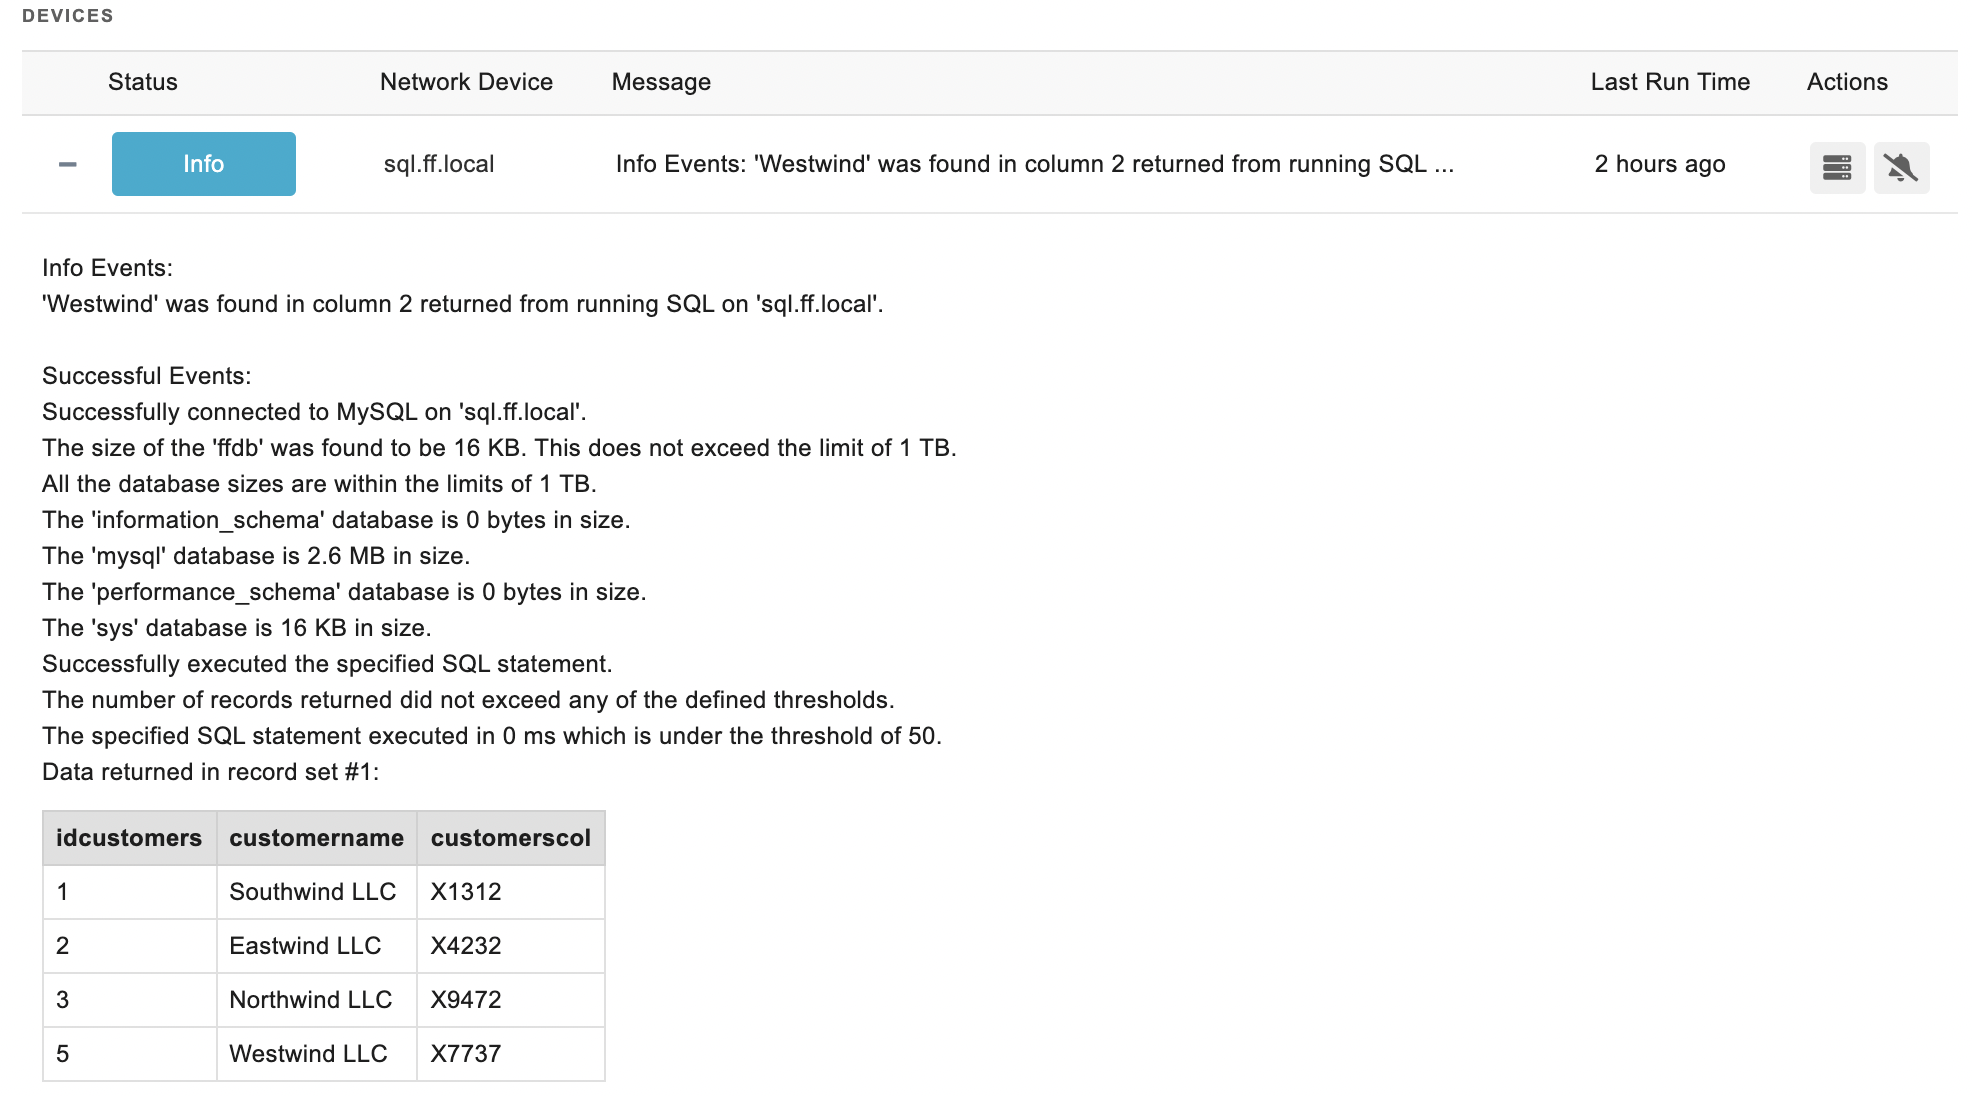
Sample Output

Comments
Add a comment