Linux/SSH Bandwidth Event Monitor Reference Guide
Linux/SSH Bandwidth Event Monitor
Monitors bandwidth on your Linux/SSH devices.
Overview
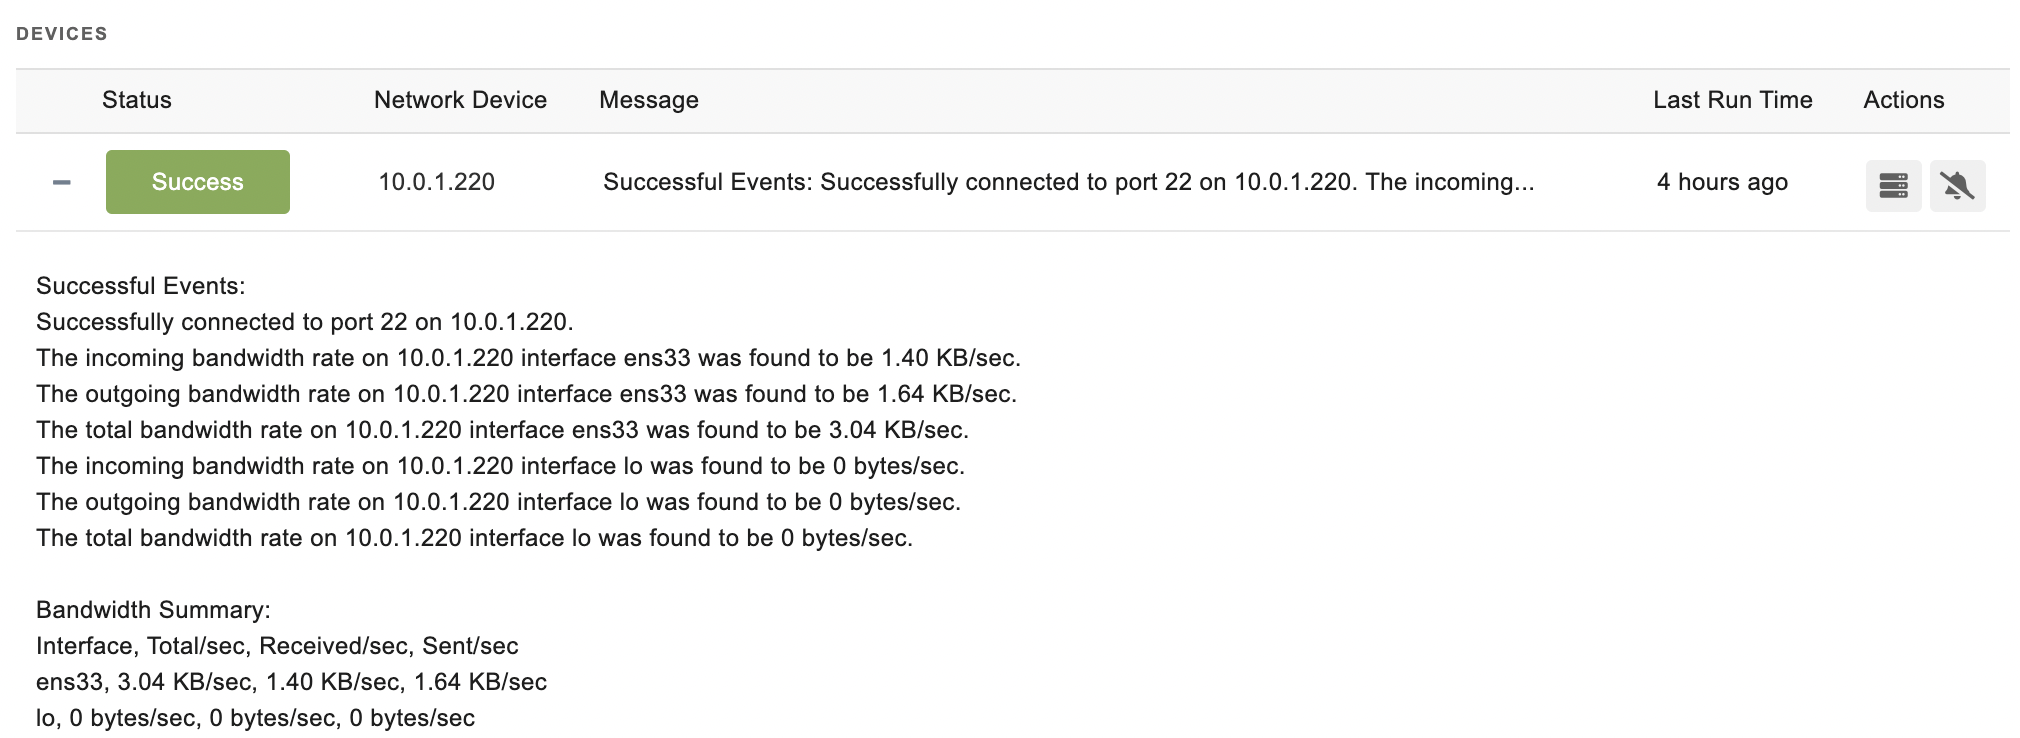
This event monitor connects to your Linux-based systems using SSH and collects bandwidth data. It can measure and record the incoming, outgoing, and total bandwidth rates. It also has filtering options that allow you to ignore selected interfaces that you do not want to monitor.
Use Cases
- Monitoring incoming, outgoing, and total bandwidth for your SSH/Linux devices
- Detecting systems that are using excessive bandwidth
Monitoring Options
This event monitor provides the following options:
Alert with [Info/Warning/Error/Critical] if the device cannot be contacted
Use this option to control whether or not you will be notified if the event monitor is unable to establish an SSH connection.
Alert if the incoming bandwidth on any interface exceeds a specified value
Use this option to set alerting thresholds based on the incoming bandwidth rate.
Alert if the outgoing bandwidth on any interface exceeds a specified value
This option alerts based on the outgoing bandwidth rate.
Alert if the total bandwidth on any interface exceeds a specified value
The total bandwidth rate is the sum of the incoming and outgoing rates. Use this option to set alerting thresholds based on the total rate.
Connect on port number
The default port for SSH connections is 22 but if your servers are using a non-standard port, you can specify it here.
Interfaces to ignore
Enter the names of the interfaces to ignore separated by commas (e.g. "Realtek, Marvell"). Note that interface names can be a partial match. To see the indexes, leave this field blank and run the event monitor once. Check the resulting event history record to get a list of interface names detected.
Authentication and Security
The account used for authentication must have interactive login rights via SSH. In addition, the account must have permission to run one of the following commands:
- cat /proc/net/dev
- netstat -b -i
Protocols
Data Points
This event monitor generates the following data points:
| Data Point | Description |
|---|---|
| Incoming Bandwidth | The incoming bandwidth for a network device. |
| Outgoing Bandwidth | The outgoing bandwidth for a network device. |
| Total Bandwidth | The combined total bandwidth for a network device. |
Tutorial
To view the tutorial for this event monitor, click here.
Sample Output

Comments
Add a comment