HP iLO Event Monitor Reference Guide
HP iLO Event Monitor
Monitors fans, power supplies, and temperatures.
Overview
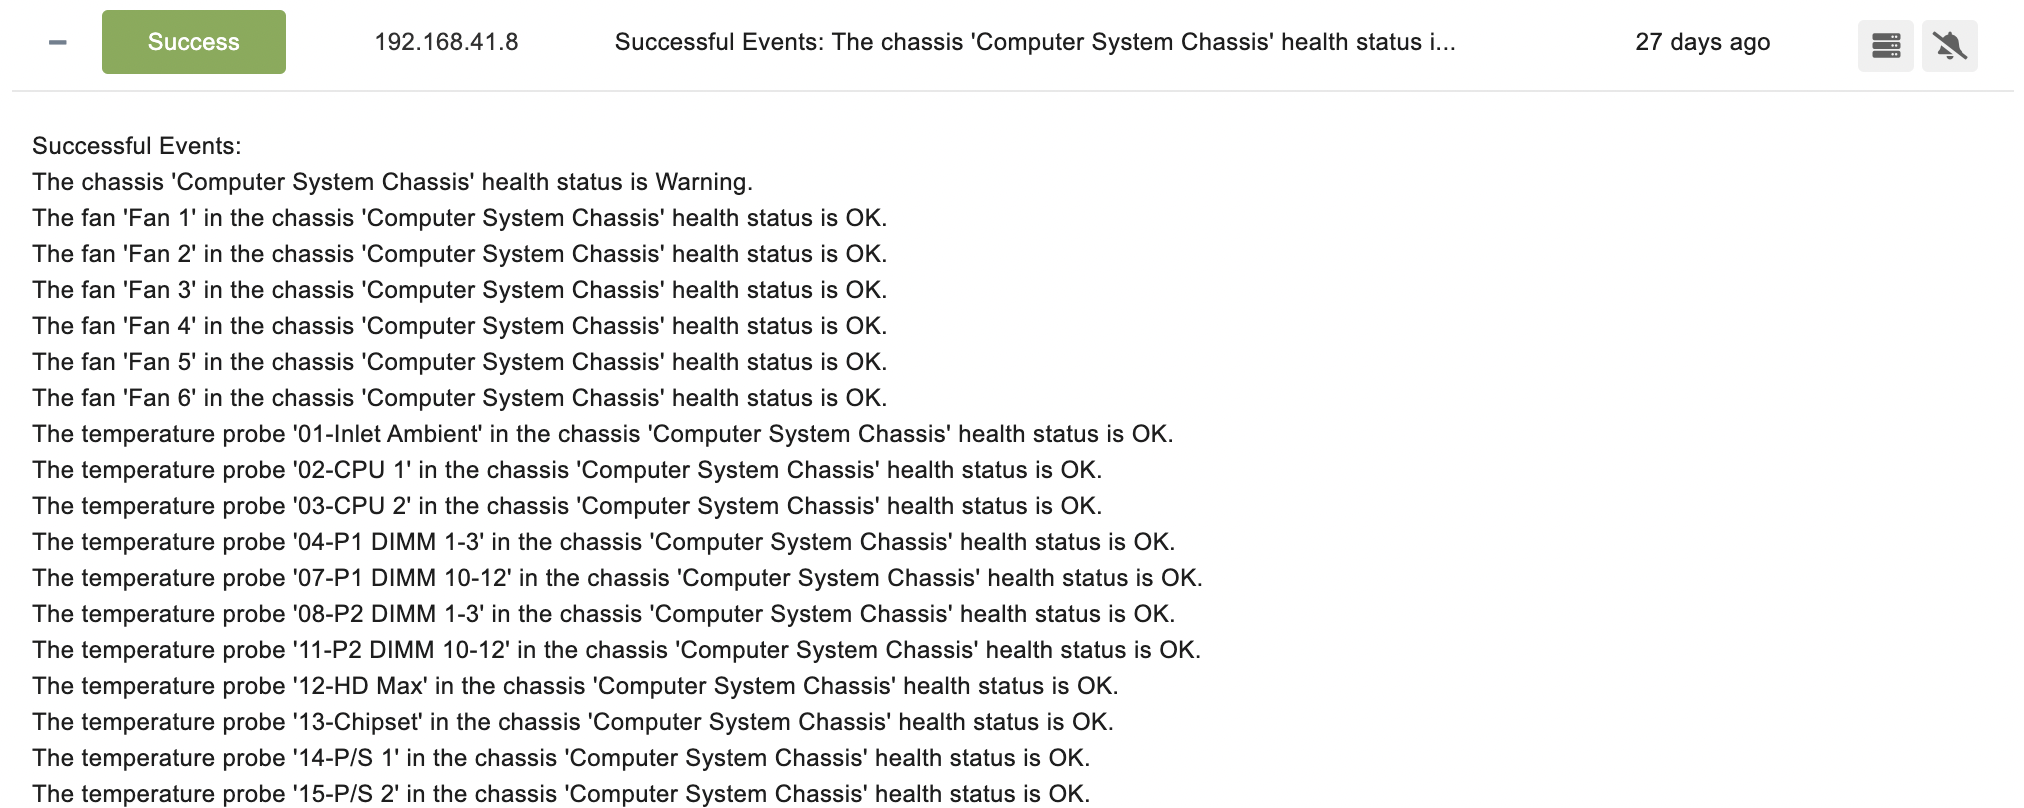
The HP iLO Event Monitor connects to the "Integrated Lights Out" system found on many systems sold by Hewlett Packard. iLO provides hardware-related data about a system, including details about fans, temperatures, and power supplies.
Use Cases
- Monitoring the hardware health status of your Dell servers
- Alerting based on high power consumption
- Notifying about battery status and temperature
Monitoring Options
This event monitor provides the following options:
HP iLO Version
Select the version of iLO on the systems to be monitored. For iLO 2 and iLO 3, the HP Lights-Out Configuration Utility (CPQLOCFG.EXE) must be downloaded. HP's utility can be found here. After running the setup the utility will be installed in "C:\Program Files (x86)\HP Lights-Out Configuration Utility". Move all of the files in that folder into "C:\Program Files\FrameFlow", then run the event monitor.
Alert with [Info/Warning/Error/Critical] if the HP iLO server is unreachable
Use this option to get alerts if the iLO system could not be contacted.
Alert with [Info/Warning/Error/Critical] if chassis health status is not OK
Use this option to get alerts about any alarms related to the system chassis.
Alert with [Info/Warning/Error/Critical] if chassis power supply health status is not OK
This option will alert you about power supplies and their status.
Alert with [Info/Warning/Error/Critical] if fan health status is not OK
Use this option to get alerts related to fans and their speeds.
Alert with [Info/Warning/Error/Critical] if temperature probe health status is not OK
Use this option to get alerts about the availability of temperature probes on the system.
Alert with [Info/Warning/Error/Critical] if system health status is not OK
Use this option to get alerts about the general health of the system.
Alert with [Info/Warning/Error/Critical] if array controller health status is not OK
This option will alert you about array controllers and their status.
Alert with [Info/Warning/Error/Critical] if logical drive health status is not OK
Checks the status of all logic drives and alerts the health status of any is not OK.
Alert with [Info/Warning/Error/Critical] if disk drive health status is not OK
Checks the status of all physical drives and alerts the health status of any is not OK.
Alert with [Info/Warning/Error/Critical] if a temperature probe is greater than its threshold
Use this option to get temperature alerts for critical and non-critical levels as defined by the iLO system settings.
Alert if the temperature of a disk drive is more than the specified thresholds
Checks the temperature of physical disks and alerts if the value exceeds the thresholds that you choose.
Alert with [Info/Warning/Error/Critical] if array controller backup power status is not OK
Alerts about backup power status for array controllers.
Alert with [Info/Warning/Error/Critical] if the available power for a chassis is less than specified thresholds
Use this option to set alerts about power availability for the chassis.
Alert with [Info/Warning/Error/Critical] if the average consumed power for a chassis is greater than specified thresholds
This option lets you set thresholds based on power consumption for the chassis.
Alert if a fan's speed is running greater than specified speeds
Checks fan speeds and alerts based on the values you specify. Thresholds are specified as a percentage of maximum fan speed.
Authentication and Security
The account used for authentication must be able to access the iLO interface.
Protocols
Data Points
This event monitor generates the following data points:
| Data Point | Description |
|---|---|
| Available Power | The power available to your devices. |
| Consumed Power | The total power consumed by your devices. |
| Average Consumed Power | The average amount of power consumed by your devices. |
| Fan Speed | The detected speed of your fans. |
| Temperature | The temperature of your devices. |
Tutorial
To view the tutorial for this event monitor, click here.
Sample Output

Comments
Add a comment