Drive Space Event Monitor Reference Guide
Drive Space Event Monitor
Monitors available drive space.
Overview
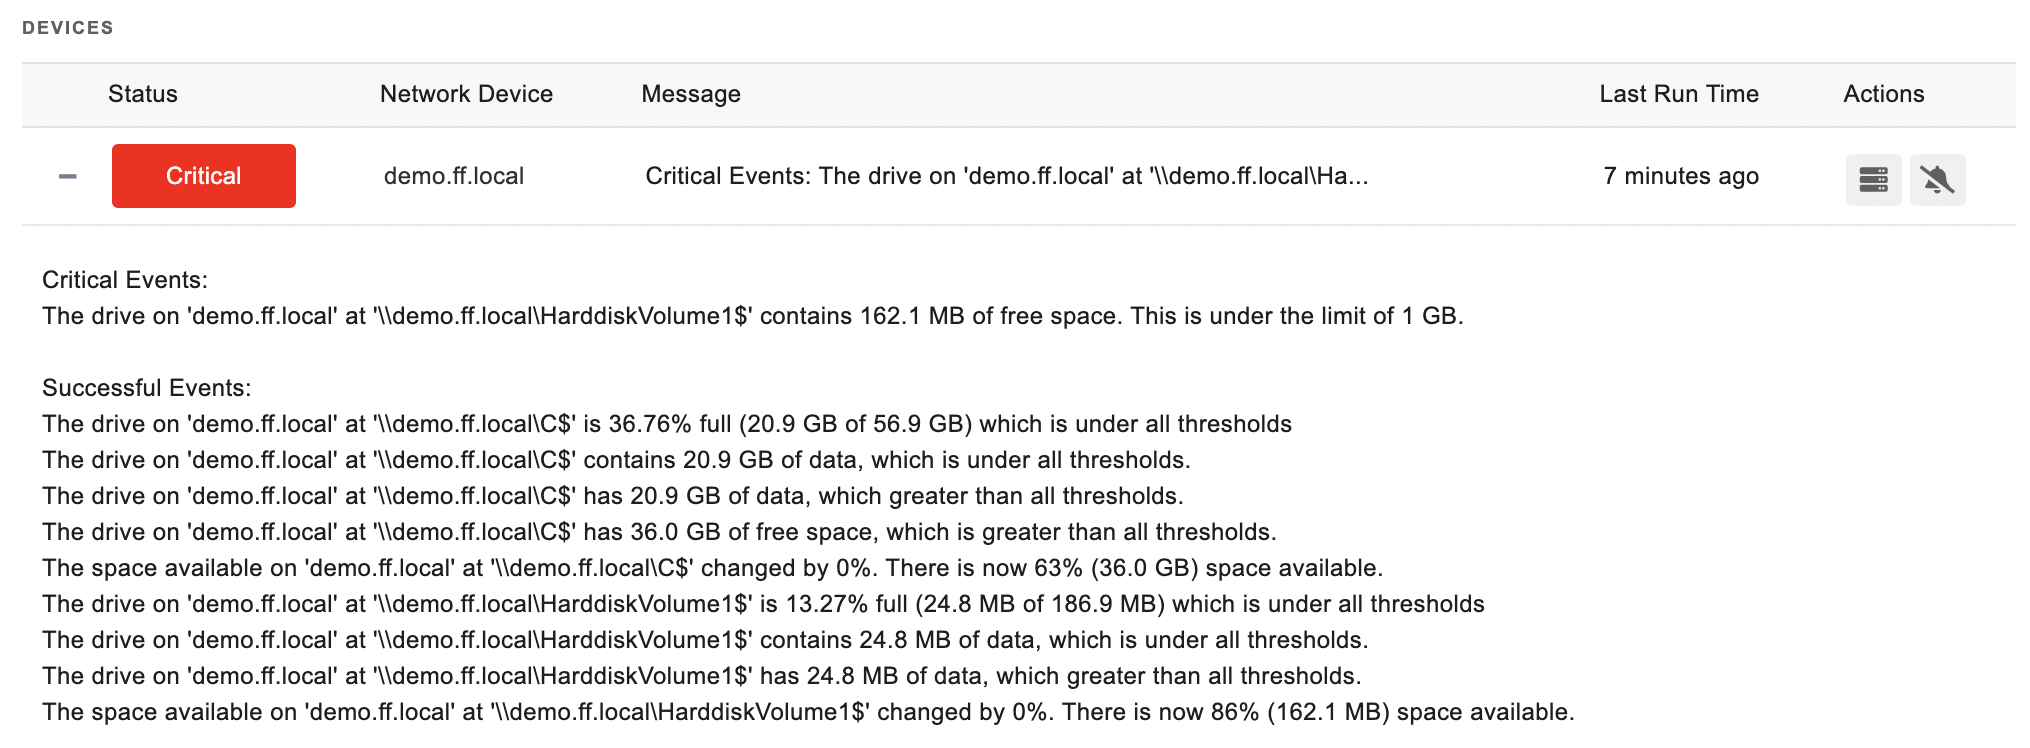
The Drive Space Event Monitor watches available space on your disks and partitions. It has multiple methods to alert you based not only on the amount of available space but also based on percentage changes. Also included are robust options to filter based on drive sizes and assigned letters.
Use Cases
- Detecting when drives are running low on space
- Detecting significant changes in available disk space
Monitoring Options
This event monitor provides the following options:
Protocol
Select the protocol that will be used to collect the drive space data. We recommend using the default value "Windows Performance Counters (PDH)" as it is the most reliable method. In rare cases where performance counters are unavailable, one of the other available protocols can be used. For non-Windows systems, use "Simple Network Management Protocol (SNMP)".
Check all drives/Specify drive letters
Use this option to tell the event monitor which drives it should check. If the option to check all drives is selected, it will automatically detect drives and alert based on the settings you choose. Alternatively, you can explicitly select the drives you want to monitor.
Alert with [Info/Warning/Error/Critical] if a selected drive is not found
This option is available if you have chosen to monitor specific drives. With this option enabled the event monitor will alert if a drive letter has been selected but no matching drive was found on the network device being monitored.
Alert with [Info/Warning/Error/Critical] if the device cannot be contacted
With this option enabled the event monitor will alert with the selected status if any selected network device could not be contacted.
Alert if drives have less than a specified amount of free space available
Use this option to generate alerts if any drive has less than the specified amount of available space.
Alert if drives are more than a specified percentage full
Use this option to alert based on how full drives are as a percentage.
Alert if drives contain more than a specified amount of data
This option is the inverse of the option to warn about the amount of free space available. Instead, it alerts based on the amount of space used as an absolute value.
Alert if drives contain less than a specified amount of data
In some circumstances, you may want to be alerted if data is removed from a drive. Use this option to get alerts when the amount of drive space used falls below the thresholds that you specify.
Alert if available drive space [changes/increases/decreases] by more than a specified percentage since the last check
With this option, the event monitor will remember the drive space used detected on the previous run and compare it with what it finds on the current run. It will then alert based on the difference in size but as a percentage instead. For example, if the previous total file size was 2.0 GB and the new size is 3.0 GB, that is an increase of 50%.
Alert if available drive space [changes/increases/decreases] by more than a specified amount since the last check
Like the previous option, this option alerts based on the difference between the current amount of space used on the drive and what was detected on the last run. It will alert based on the absolute difference. Use this option to get alerts about large files. The event monitor can alert based on the detected sizes of any or all files in the directory.
Alert if [any/all] files are [newer/older] than a specified time span
Use this option to get alerts about files based on their last modified date. For example, you may have an application that regularly updates files in a folder. If they have not been updated for more than an hour it may indicate that the application has crashed. Or you may have a directory that contains static data that is not to be modified. You can use this option to get alerts when changes have been made.
Only check drives smaller than [size]
Use this option to tell the event monitor to not check any drives whose total size is larger than a specified value.
Only check drives larger than [size]
Use this option to tell the event monitor to skip drives that are smaller than a specified size. This option is handy for skipping recovery partitions and removable drives.
Authentication and Security
PDH: The account used for authentication must be a member of the Performance Monitor Users group or have admin rights.
WMI: The account used for authentication must be a member of the Performance Monitor Users group and the Distributed COM Users group, or have admin rights.
SMB: The account used for authentication must have permission to access the drive and all its contents.
SNMP: For SNMPv1 and SNMPv2c, a community string for the device being monitored is required. For SNMPv3, a username and other SNMPv3 parameters are required.
Protocols
Click on a protocol to learn more.
Data Points
This event monitor generates the following data points:
| Data Point | Description |
|---|---|
| Space Available | The available space on the drive. |
| Space Used | The space already used on the drive. |
Tutorial
To view the tutorial for this event monitor, click here.
Sample Output

Comments
Add a comment