Business Process Event Monitor Reference Guide
Business Process Event Monitor
Monitors your process chains using graph data points that represent them.
Overview
The Business Process Event Monitor uses graph data points to monitor your process chains. It can alert based on the number of graph data points as well as the data that these points represent.
Use Cases
- Monitoring the overall health of complex IT systems
Monitoring Options
This event monitor provides the following options:
Add New Unit
Use this button to add one or more units to your monitoring configuration. Then, add data points for each unit. The units start with a score of 100%. For each data point, select a penalty to apply based on the status. Optionally, choose a threshold to alert based on the score of this unit. In the event monitor's settings, you can also set alerts based on the combined score of multiple units.
Alert with [Info/Warning/Error/Critical] if one or more graph data points are not found
Use this option to be alerted if one or more datapoint is missing.
Alert if graph data points are older than a specified time span
Use this option to receive notifications when graph data points have become older than the age you specify.
Alert if the total calculated percentage is less than a specified threshold
Each unit begins with a score of 100%, diminishing with each penalty. Use this option to receive alerts when the total percentage for a unit drops below a specified percentage.
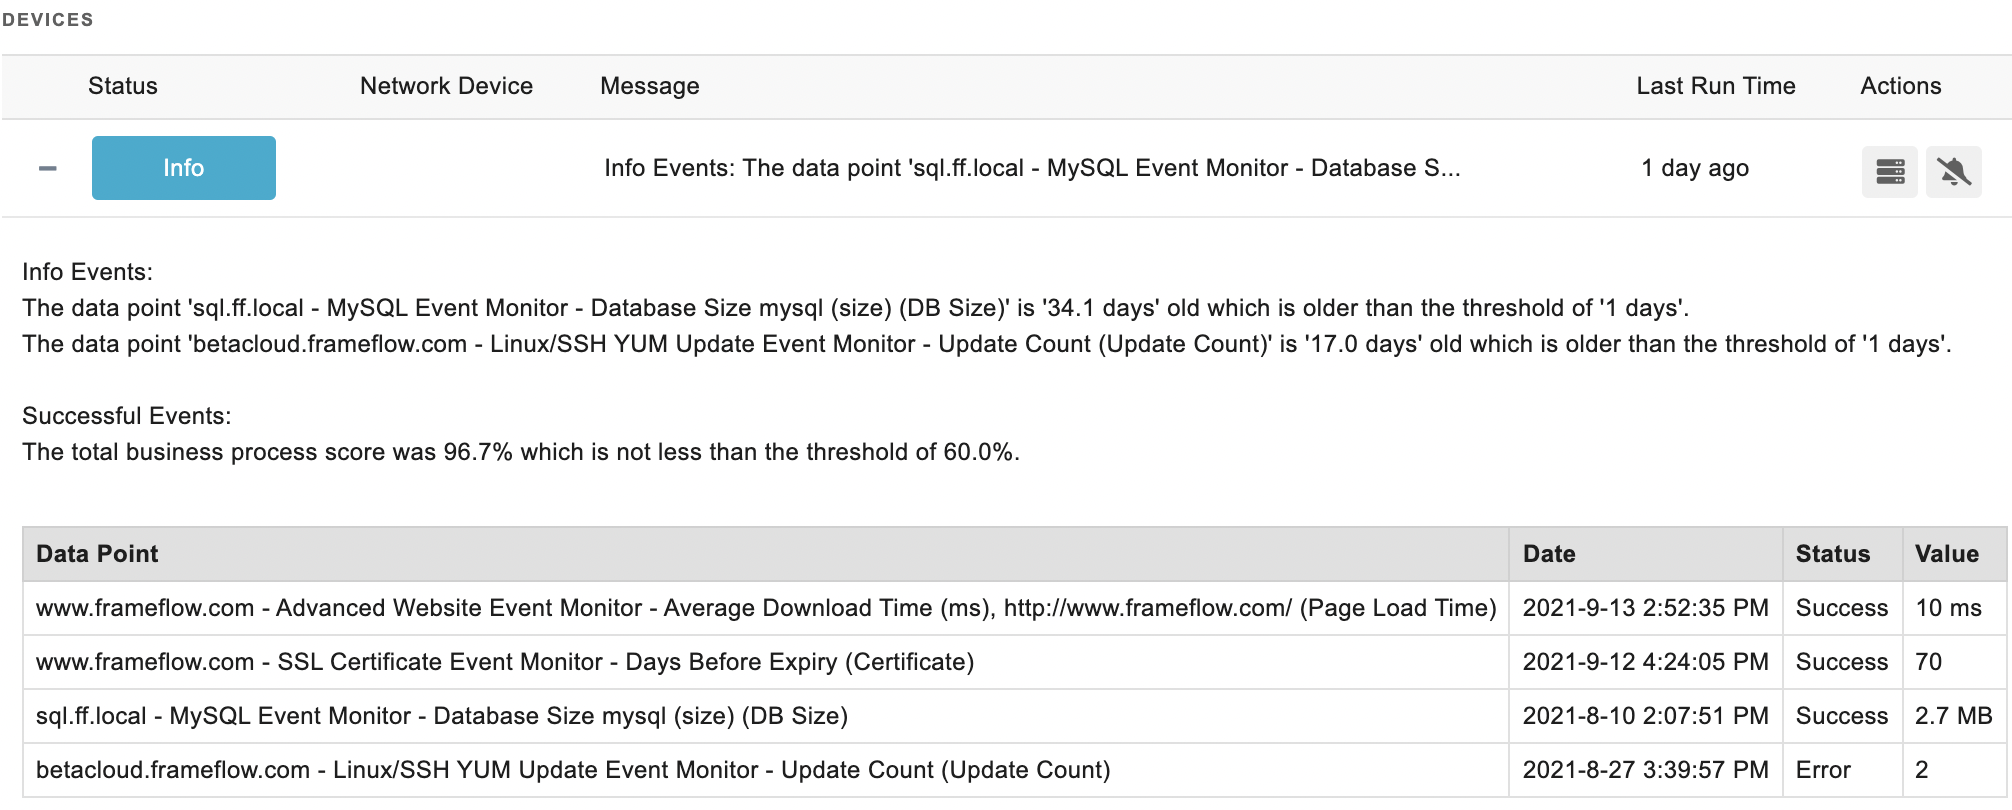
Include a table of all the graph data points
Check this box to include a table of your graph data points in the results of each event monitor run.
Authentication and Security
This event monitor does not require any authentication.
Data Points
This event monitor generates one data point for each unit you're monitoring. "Total score" is the only default data point.
Tutorial
To view the tutorial for this event monitor, click here.
Sample Output

Comments
Add a comment