Technical Resources
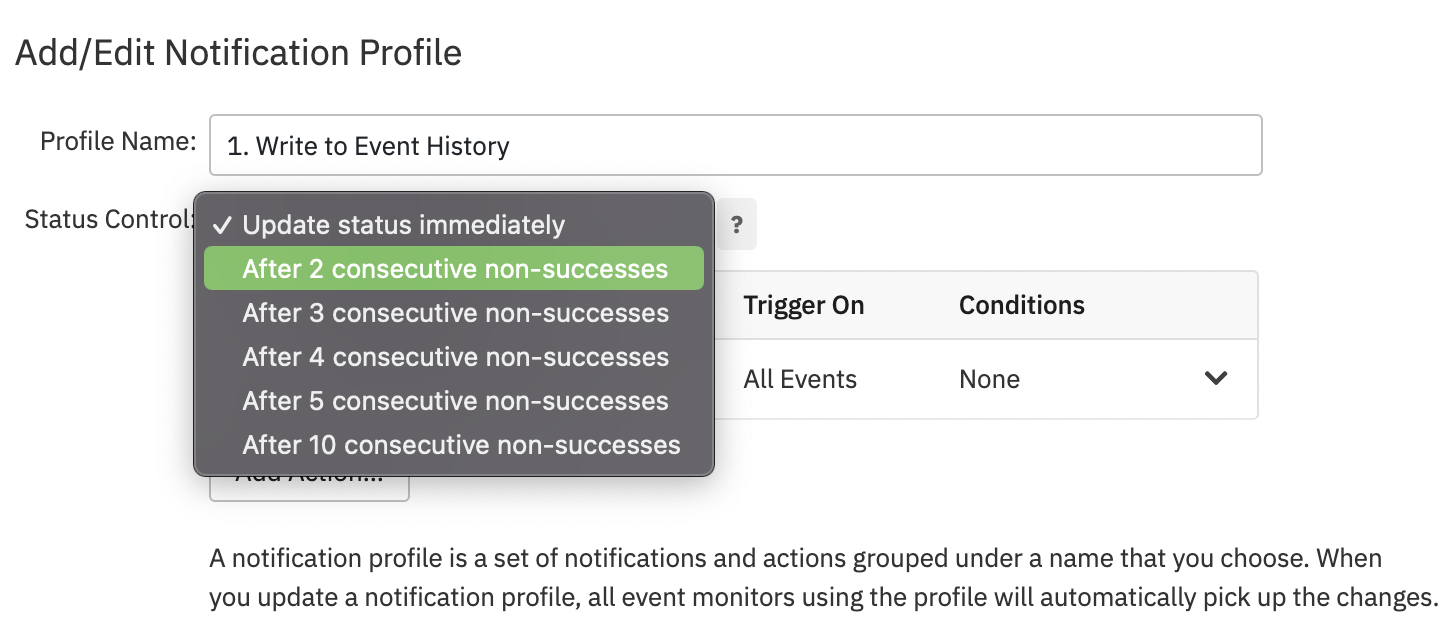
Status Control
Introduction
For most types of monitoring, you want to get alerts as soon as a device fails a check. For example, if a system is critically low on disk space, you'll want to get alerted immediately. For other types of monitoring, you only want to get alerted if there is a condition that has continued for an extended time. An example of this would be CPU monitoring. It's okay if CPU spikes up to 100% for a short period of time, but if the situation continues for an extended period, it needs attention.
Status Control
Status control lets you determine how many failures in a row it takes for an alert to switch from a success state to any other state.
 Notification Profile Window
Status control is defined in your notifications settings, either in the Notifications section of your event monitor or in the notification profile that you have assigned to the event monitor.
The default option is "Update status immediately". With this option selected, as soon as a device fails to pass a check, its status will be updated to show a warning, error, or critical alert, based on the thresholds you selected. This is the best option to select to get alerted as soon as a condition is detected.
The remaining options let you select many more failures it takes to change the device's status for the item being checked. For example, if you select "After 5 consecutive non-successes", then the status will not change until there have been 5 failures in a row.
As a concrete example, let's say you are monitoring CPU usage on a system every 5 minutes and you have selected "After 3 consecutive non-successes". The first time the CPU is detected at 100%, the event monitor will record the event but it will not change the status. Only if it fails the next two checks as well will it show a warning, error, or critical alert.
Viewing Status Control Counts
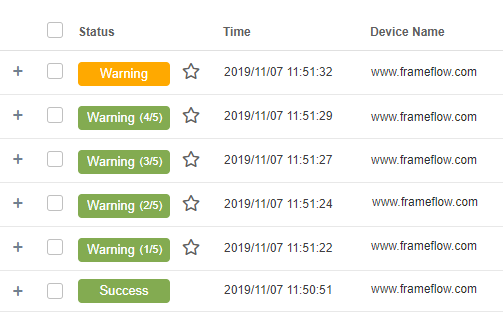
To help you see how status control works and give you a clear view of when an alert will switch to a non-success state, the event history records will show counters indicating how many non-successes have occurred so far.
Consider the example shown in the following image:
 Notification Profile Window
Looking at the events from the bottom to the top of the list, which corresponds to oldest-to-newest, we can see the following:
- The ping check for the website started in a success state.
- At 11:51:22, a warning event was generated.
- Because status control is in effect, it is shown in green with a 1/5 count indicating there has been one so far.
- In each of the next three checks, the counter goes up by one because the ping check still failed.
- In the last check, 5/5 failures have been registered, so the alert is now a true warning, shown in yellow-orange.
- Only after the 5 consecutive failures does the alert appear in Headquarters, on dashboards, and in other parts of the interface.
Alerts vs Notifications
It's important to remember that alerts and notifications are controlled independently. Status control applies to alerts and how they are shown in Headquarters, on dashboards, and in the counters displayed at the top right of the user interface.
Notifications, such as sending email alerts, are controlled by the notifications actions that you define in your event monitors and notification profiles. These have their own settings which, depending on your preferences and requirements, can be the same or different from what you have selected for status control.
If you are using status control, we have one specific recommendation: Set your notification actions for writing to the event history to either trigger on "All Events" or to trigger on "Warning, Error, and Critical" with the option to "Include one success" enabled. Doing this will give you the clearest view of how conditions changed while status control was active.