Day 9: Headquarters
30 Days of FrameFlow
About the Headquarters Section
FrameFlow's Headquarters section is the real-time hub for all your network devices and the first tab on the grey sidebar on the left of the interface. Here, you can see an up-to-date list of any conditions that may require your attention. From there, you can also suppress or resume alerts so you can focus on the most crucial alerts first and handle the rest later.
Monitoring from the Headquarters Section
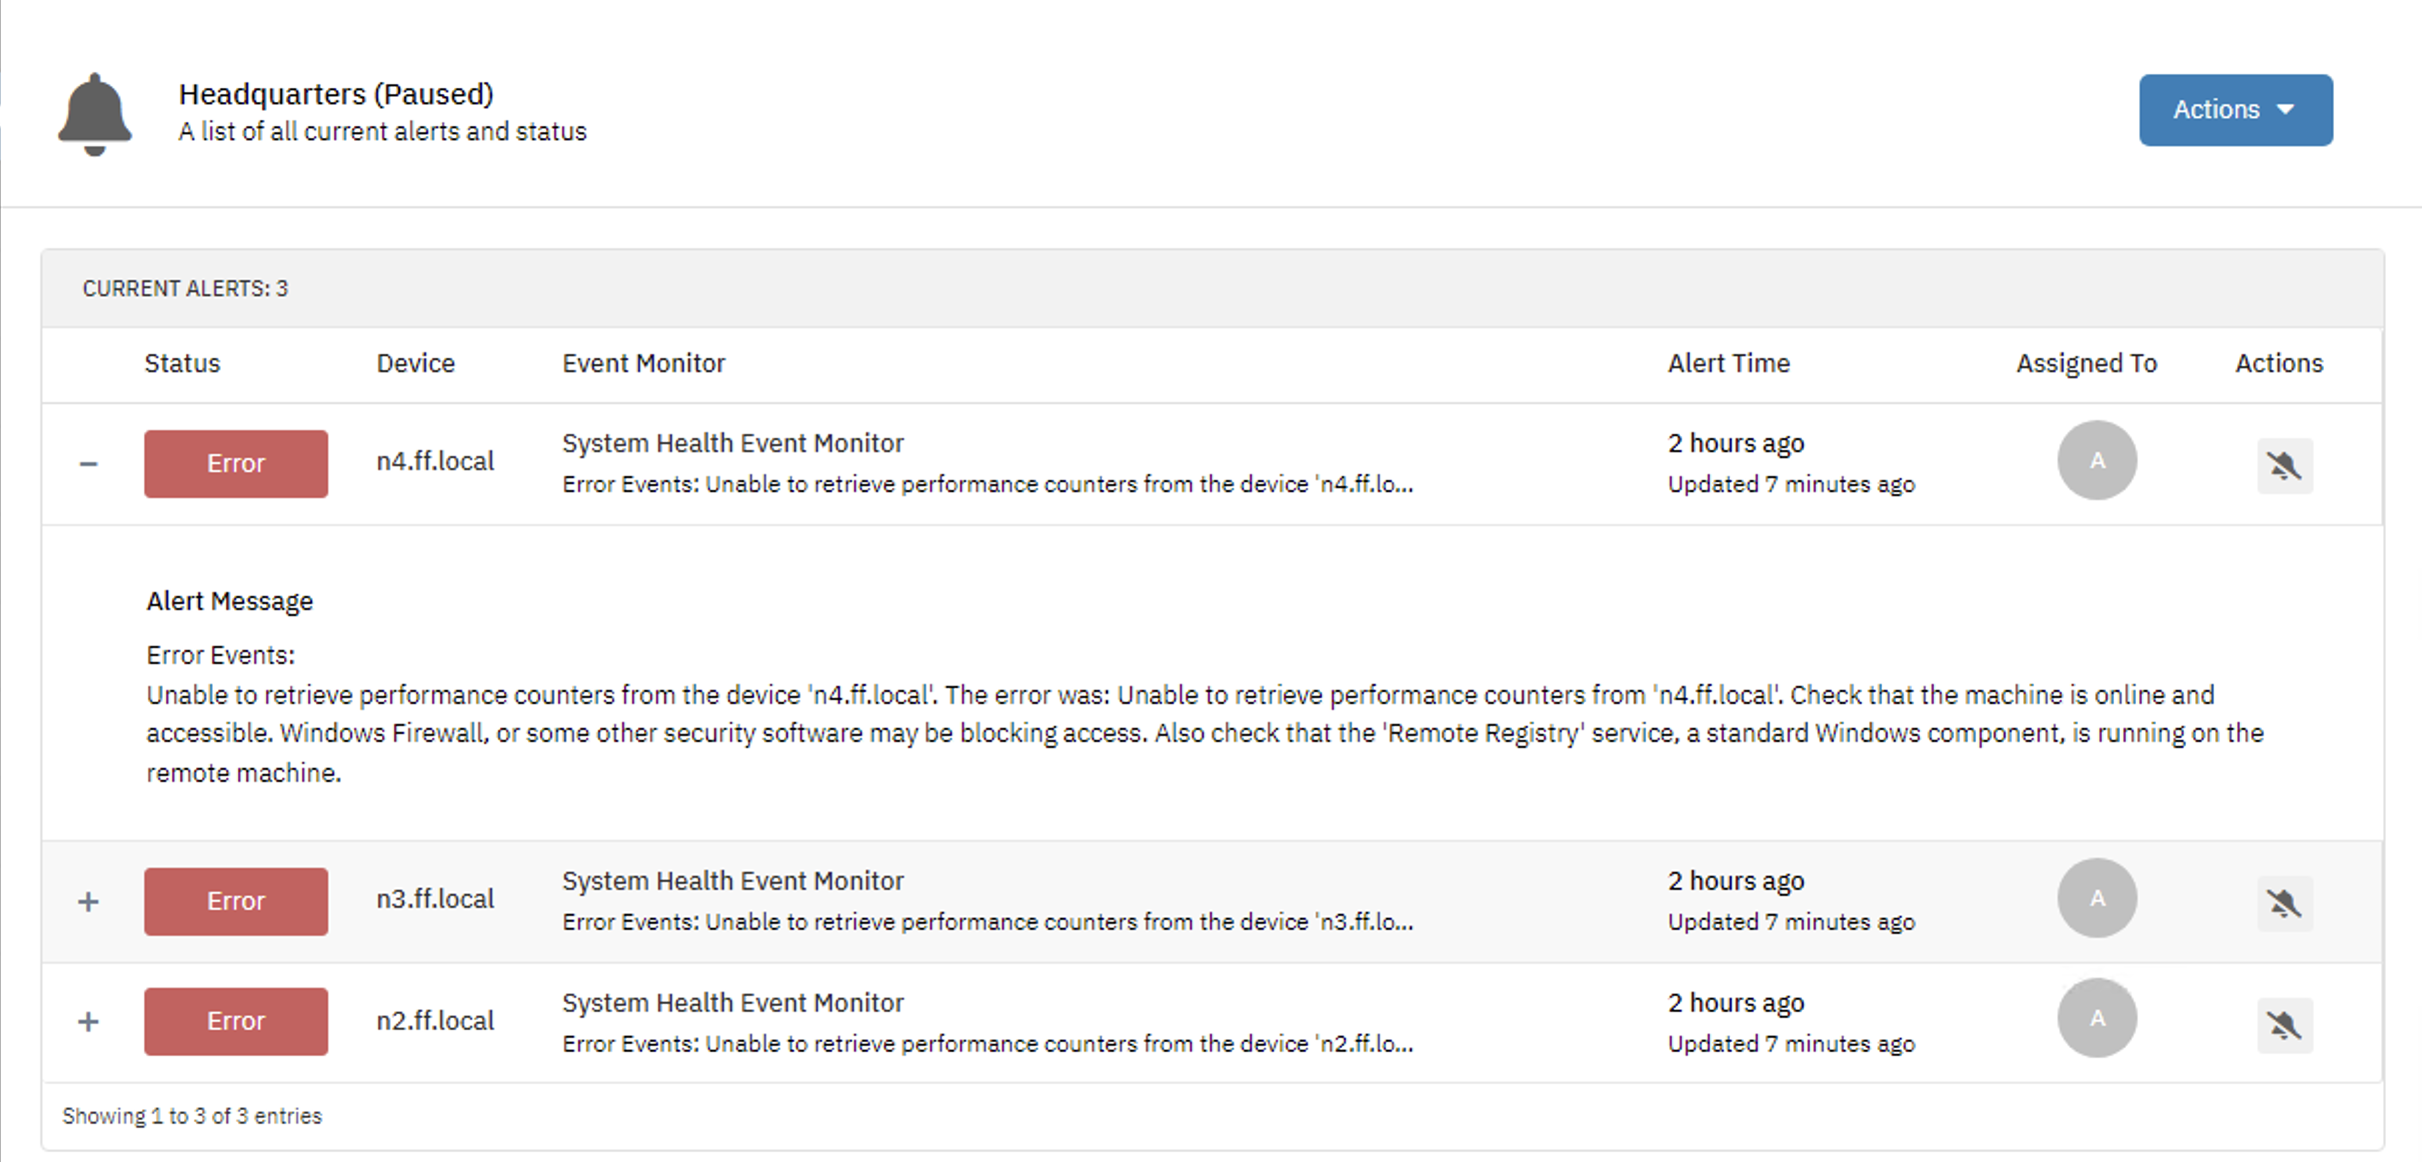
Headquarters is a live list of all active alerts. The newest alerts will come in at the top of your screen so you can quickly identify new issues as they occur. You can click on any column in the list to sort by it.

Suppressed/paused event monitors continue to collect data but don't send out alerts, meaning they can be easily forgotten. That's why Headquarters also has a section that lists paused devices and monitors so you don't forget about them after you've set them as paused.

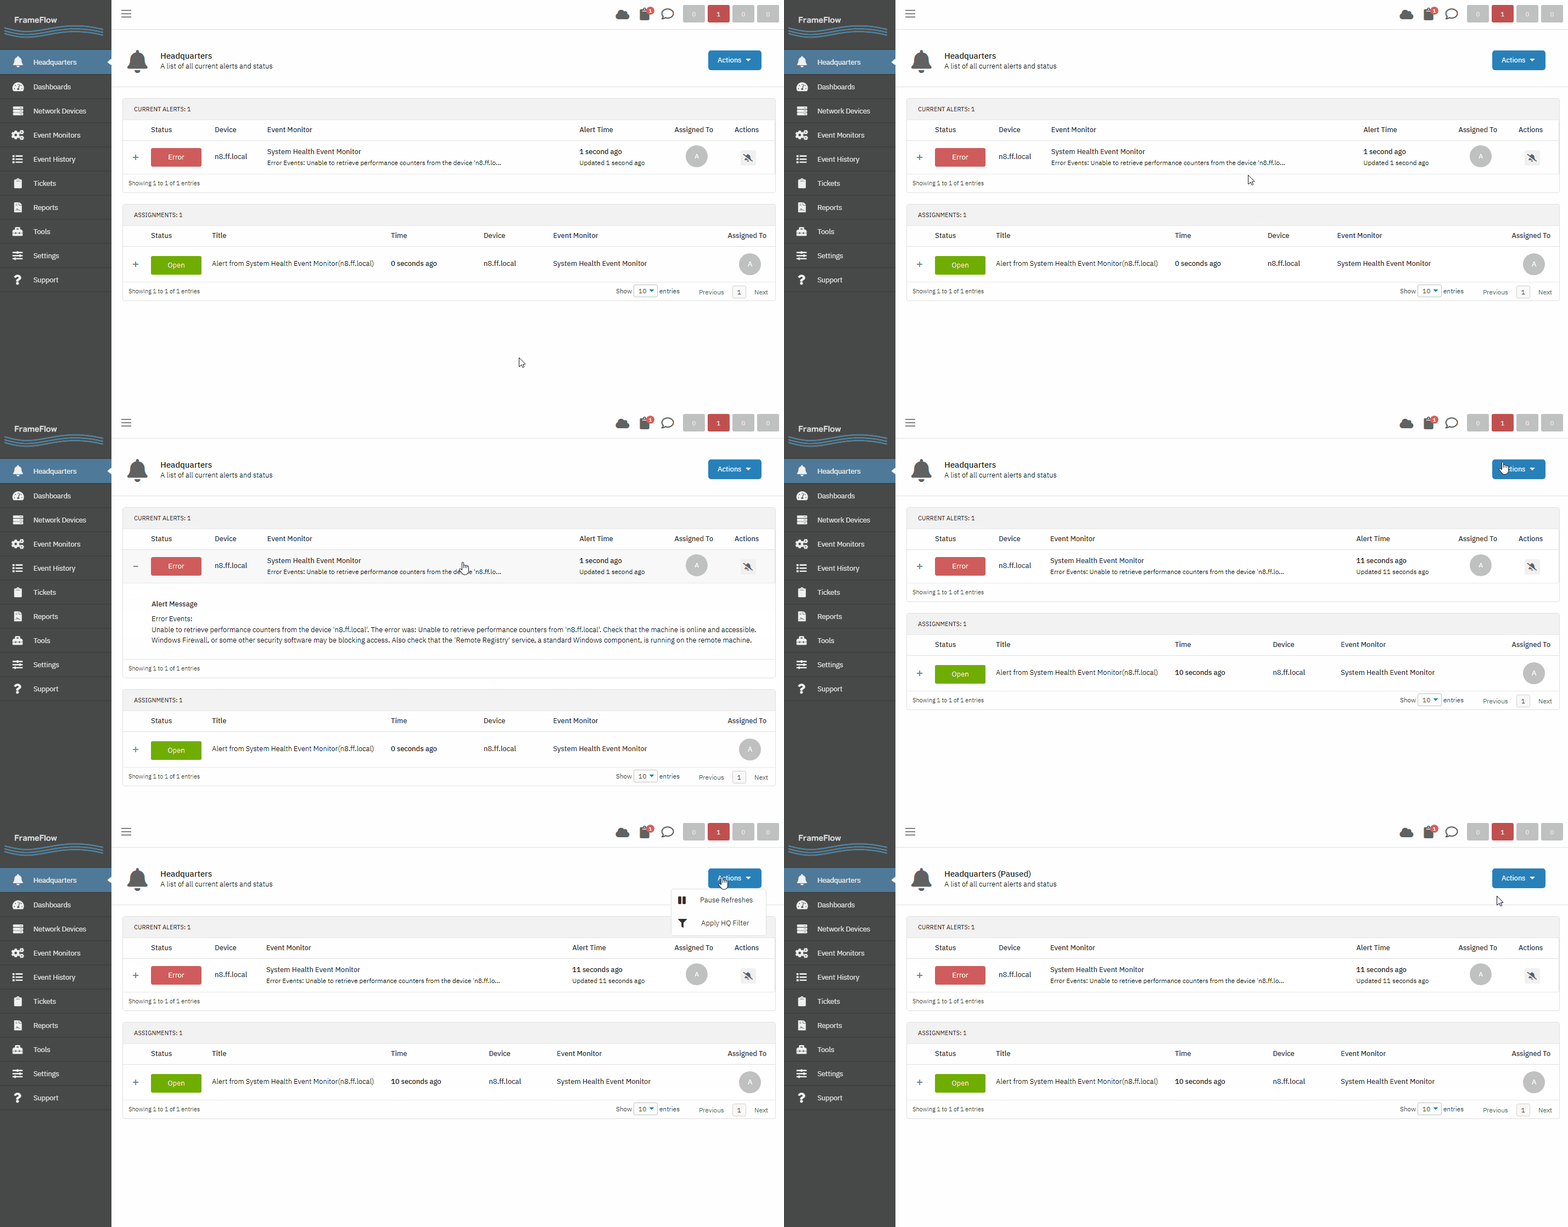
You can also expand individual alerts to get complete details about what triggered the alert and why. Sometimes, you need to focus on an event that comes in and for this reason, it's advantageous to be able to pause live updates. To do this, click on the Actions menu and choose "Pause Refreshes". Whenever you're ready to resume them, you can do so using the Actions menu.

Under the tab "My Alerts", you can find the alerts that have been assigned to your account.

Assigning Tickets from Headquarters
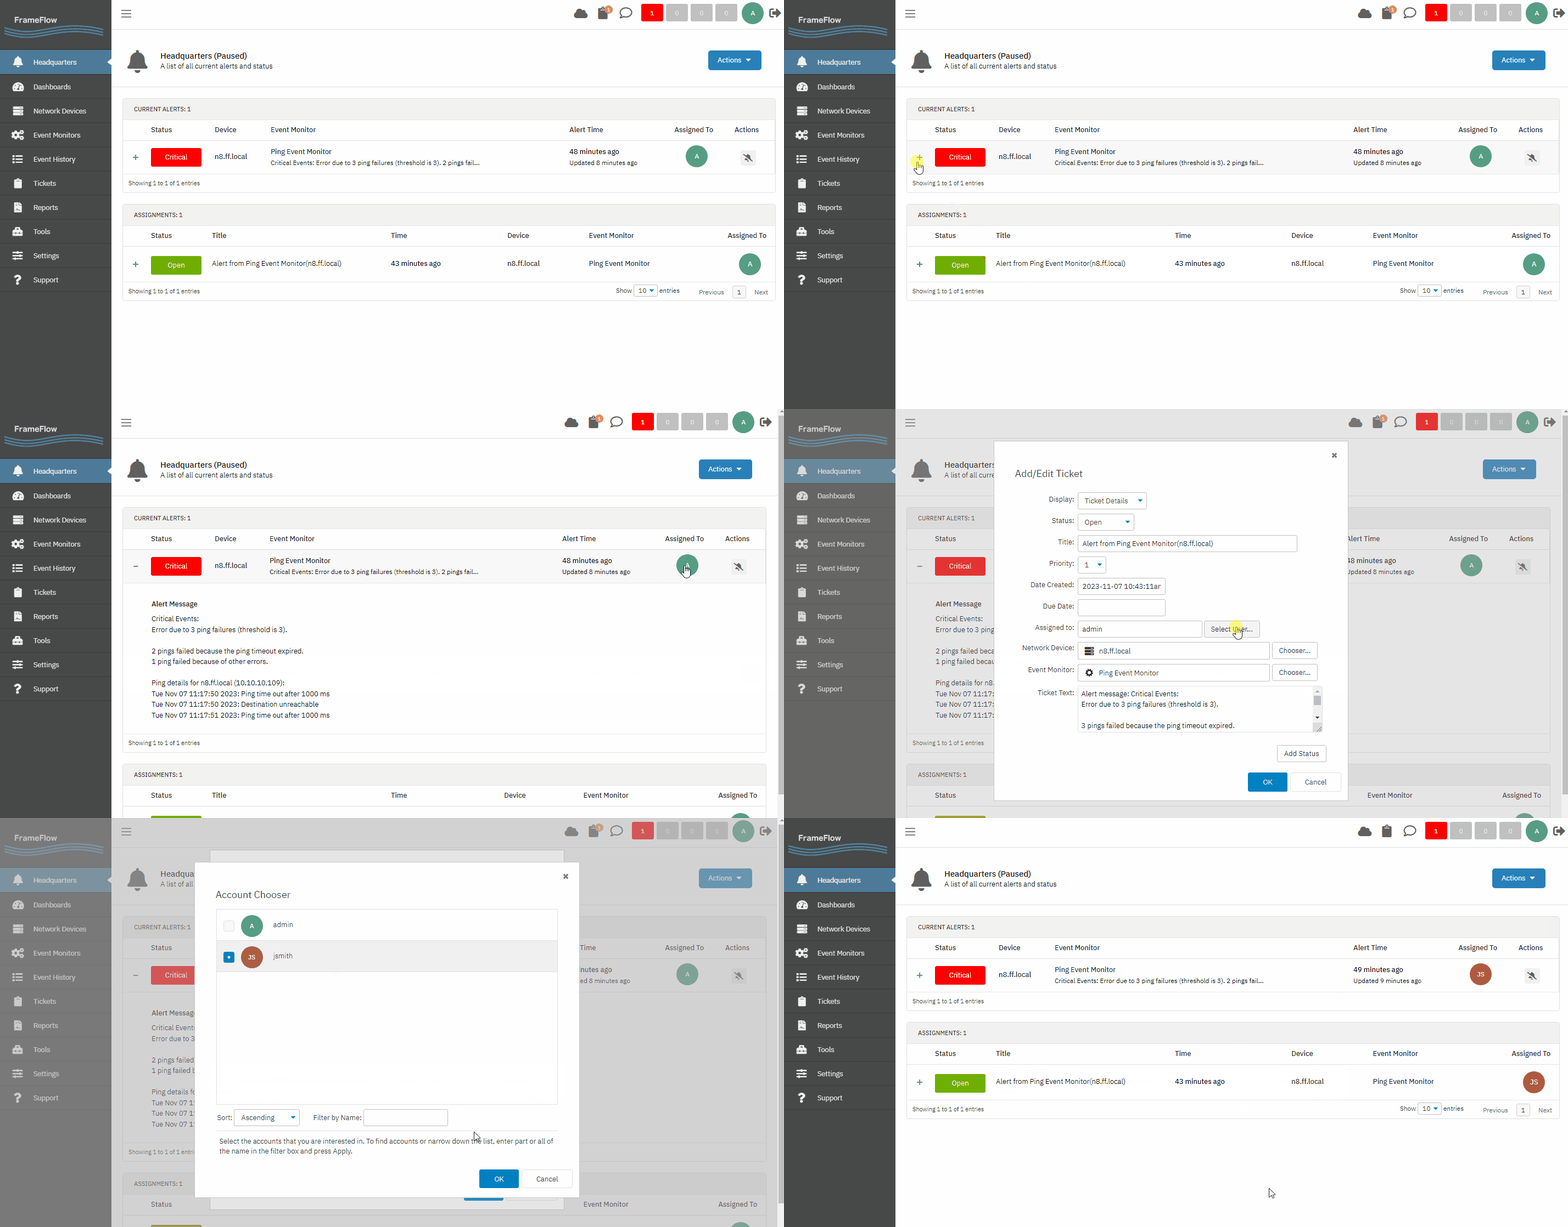
Did you know that you can assign alerts to different members of your IT team using tickets? To do so from Headquarters, select the alert you would like to assign to a team member. Click on the "Assigned To" column to open a ticket creation menu you can use to assign the alert to a member of your team, as in the GIF below.

Summary
Now that you know about the Headquarters section, spend some time watching alerts and notifications roll in. Moving forward, this will be one of the main sections of FrameFlow to watch for incoming alerts. From here, you can assign alerts to team members, pause alerting, and filter to show only the relevant alerts. Tomorrow, we're covering the Dashboards section and showing you how to visually represent your monitoring configuration, so make sure to tune in!
| Day 8: Event Monitor Categories | Day 10: Dashboards |
Table of Contents
Back to Menu
Day 1: Intro and Installation
Day 2: FrameFlow's Interface
Day 3: Network Devices
Day 4: Your First Event Monitors
Day 5: Authentication Profiles
Day 6: Security
Day 7: System Health Event Monitor
Day 8: Event Monitors by Category
Day 9: Headquarters
Day 10: Dashboards
Day 11: Alert Types
Day 12: PowerShell Scripting
Day 13: Event History
Day 14: Reports and Inventory Monitoring
Day 15: Network Monitoring
Day 16: Cloud Service Monitoring
Day 17: Cloud Cost Monitoring
Day 18: Activity Monitoring
Day 19: Maintenance Windows
Day 20: Dependencies
Day 21: VMware Monitoring
Day 22: Benefits of Organization
Day 23: Assigning Device Types
Day 24: Security Best Practices
Day 25: Database Monitoring
Day 26: Hardware Monitoring
Day 27: Installation Health Event Monitor
Day 28: Multi-Site and Remote Nodes
Day 29: Failover Monitoring
Day 30: More FrameFlow Resources