Day 7: System Health Event Monitor
30 Days of FrameFlow
About the System Health Event Monitor
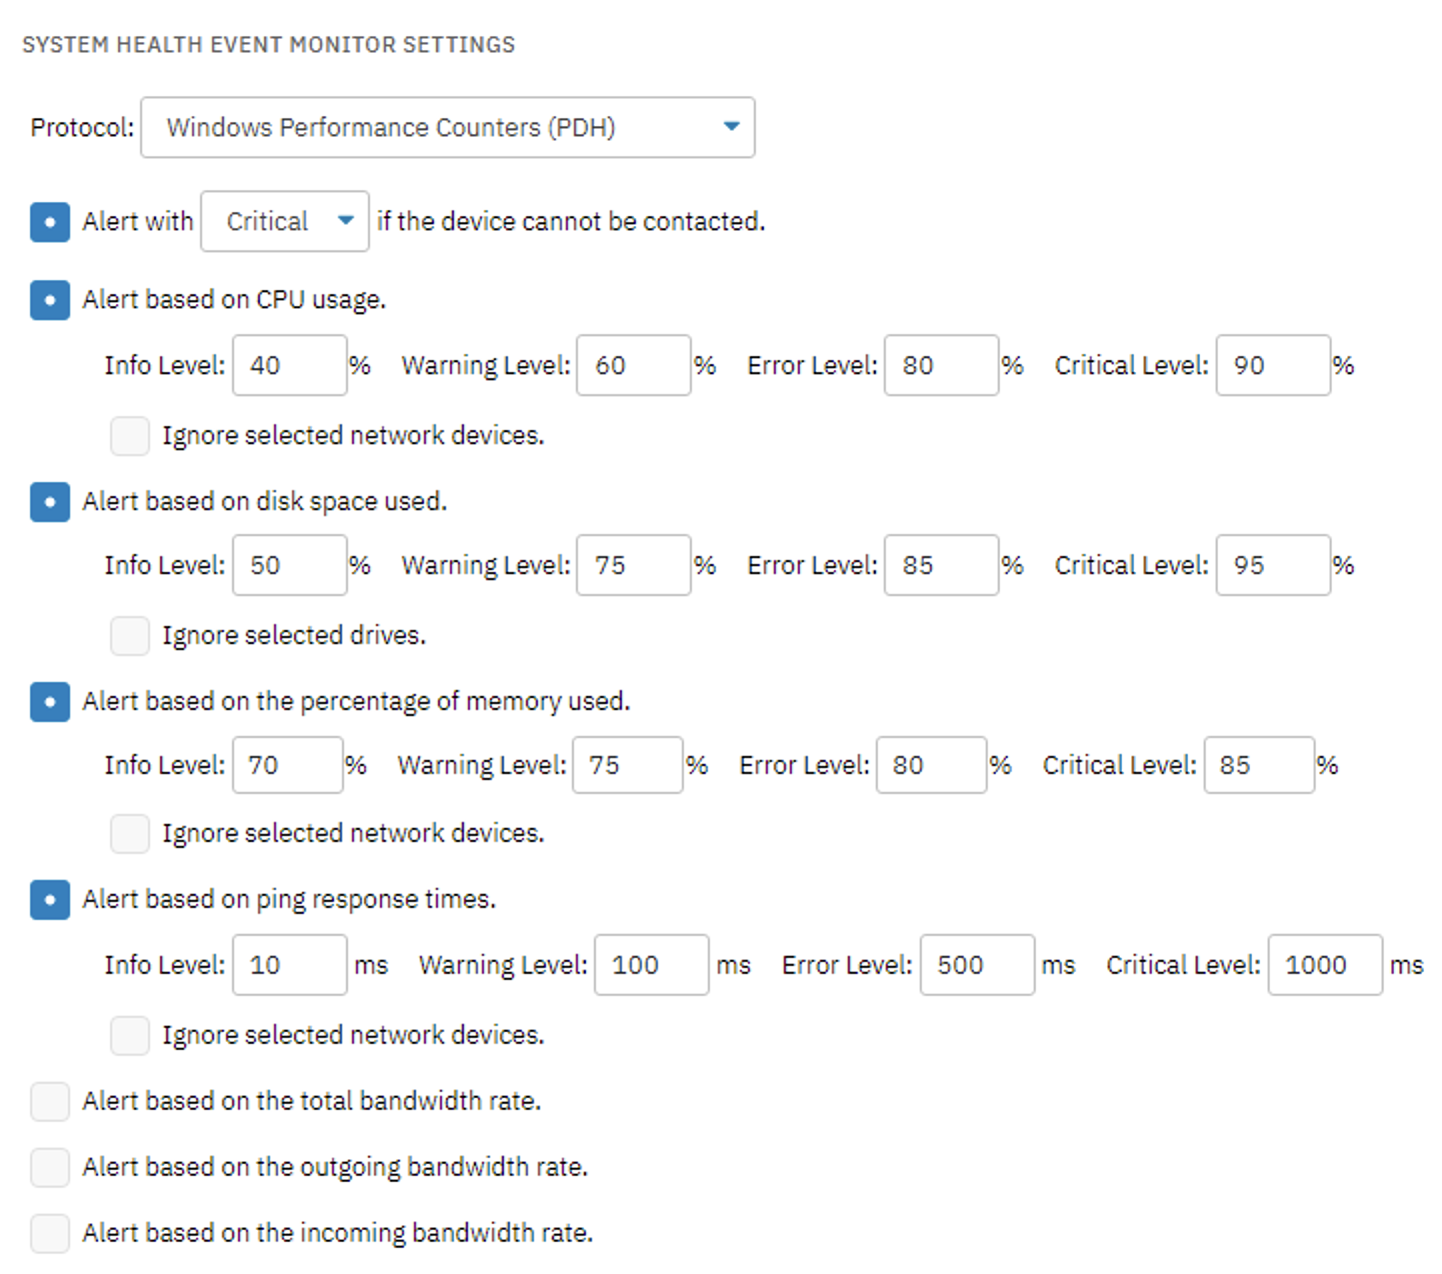
Now that we've got login and security details, we can turn our attention to system health monitoring. FrameFlow's System Health Event Monitor watches over five key system health metrics for each connected device: CPU usage, disk space, memory usage, bandwidth, and ping response time.
Every FrameFlow configuration should have at least one System Health monitor. The System Health Event Monitor is one of the most important tools in your FrameFlow configuration. Keeping a close eye on these metrics ensures the continued health of your Windows and Linux systems. Data gathered by your system health monitors also populates dedicated dashboard panels, reports, and other information across the interface. We'll explore those later on in today's lesson.
Setup
Navigate to the Event Monitors section of FrameFlow and right-click on the tree structure. Select "Add Event Monitor" from the resulting menu and choose the System Health Event Monitor from the list. Once you're in the Settings section of your new event monitor, you can add as many network devices as needed.

After that, it's time to fill in the event monitor settings. The System Health Event Monitor offers customizable alerting parameters for all five key metrics. Over time, you can adjust the values you enter here as you learn what the baseline values for your specific systems are.

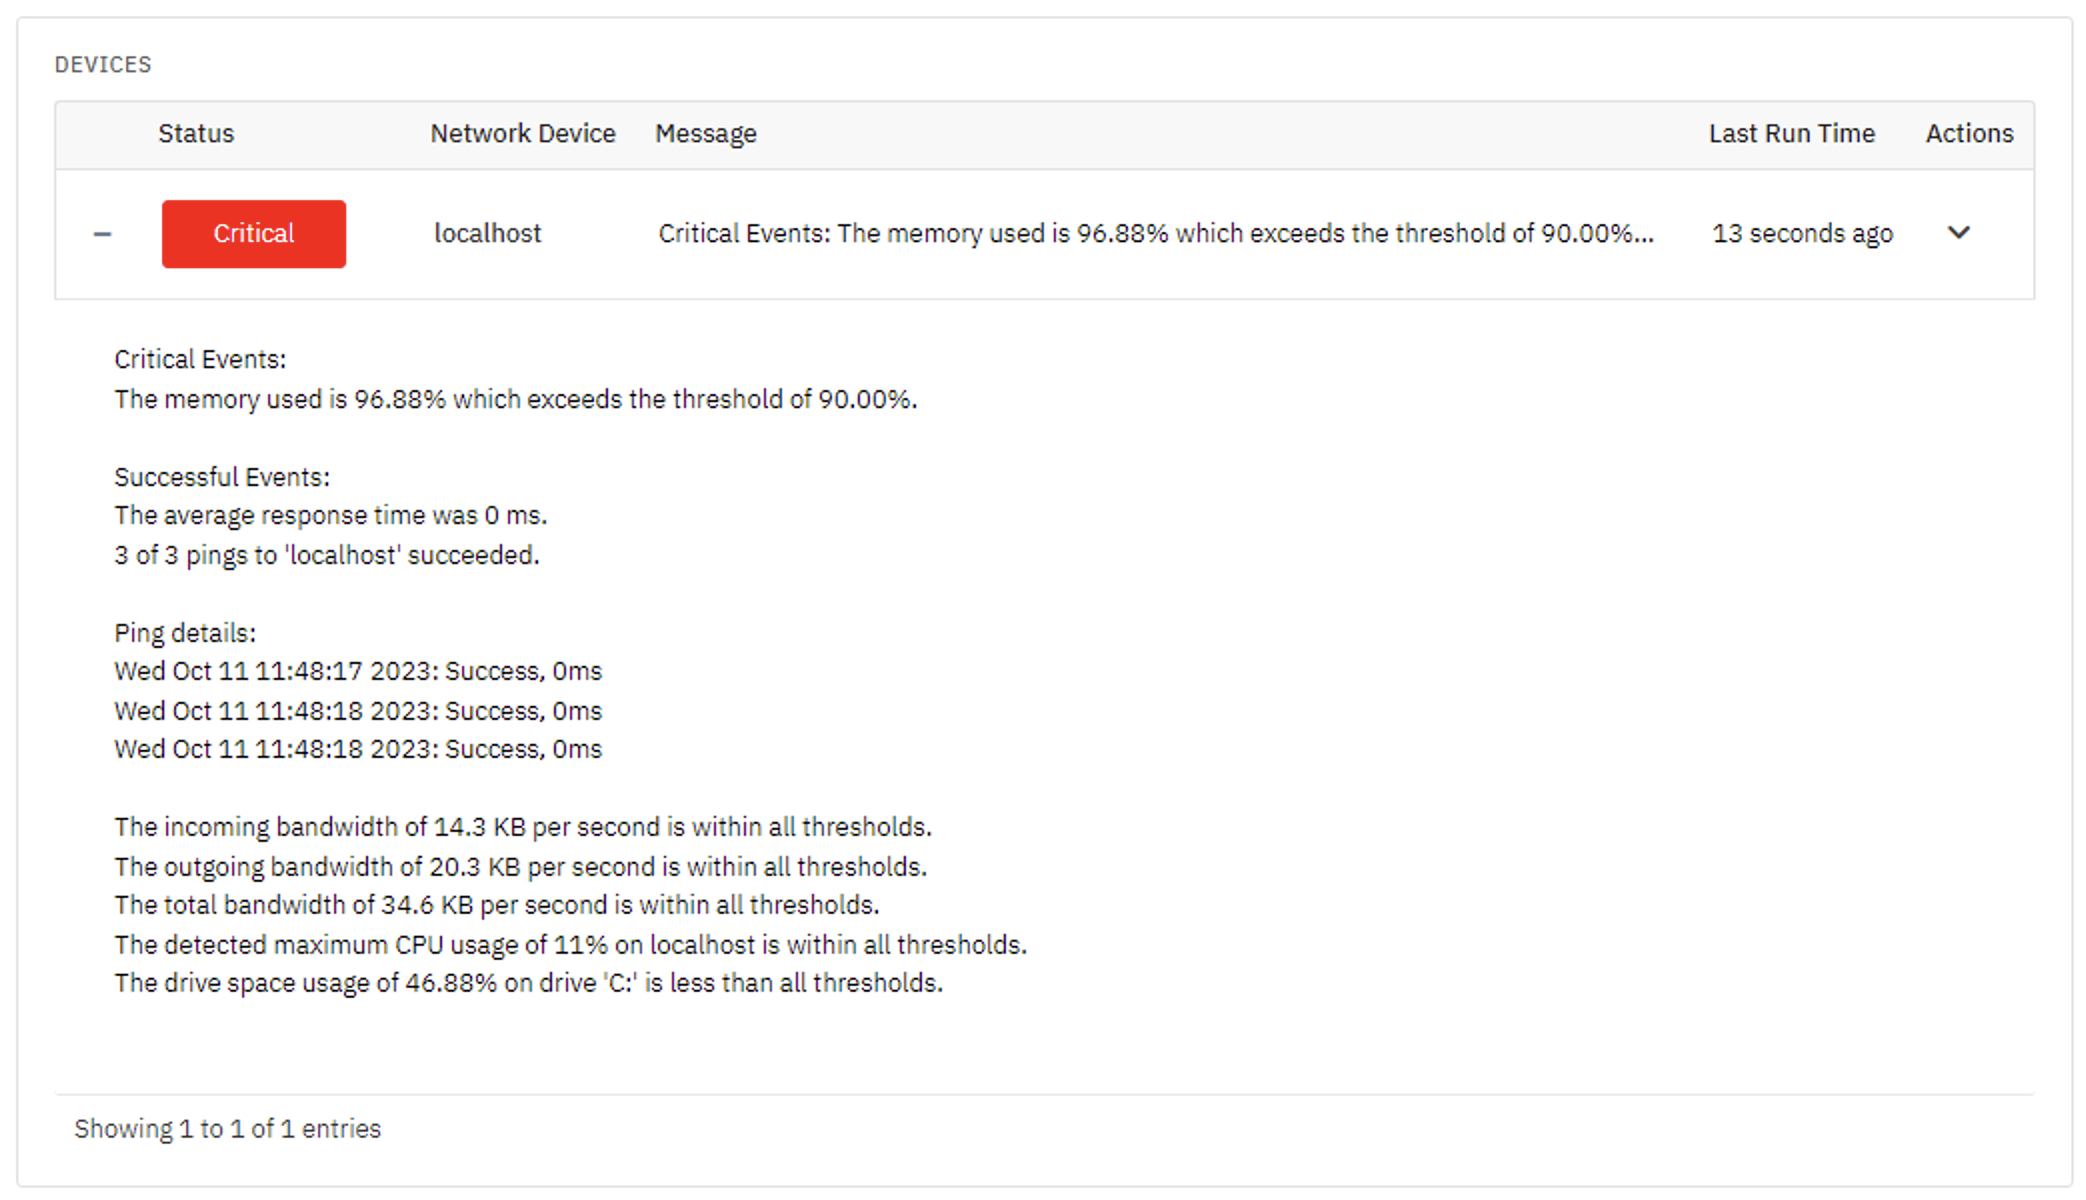
Once you've configured your settings how you want them, you can save and run the event monitor. You'll find the results of your first run in the Status tab. View past event monitor results in the History tab.

System Health Across the Interface
Just one System Health monitor in your configuration is a major asset. As mentioned before, FrameFlow has several features that draw their data from the System Health Event Monitors you have running on your FrameFlow instance. Let's explore each of them.
Dashboard Panels
Your System Health Event Monitors populate a specialized dashboard panel that displays crucial health information about your most critical systems. To begin exploring it, navigate to the Dashboards section of your FrameFlow instance. One of the default dashboard templates available to you is the System Health dashboard. If you've already created a System Health Event Monitor using the steps above, the dashboard should already be populated with data!
You can also create your own dashboard panel for system health metrics. The default example has separate panels for all five metrics, but you can also create a single dashboard panel that displays all five metrics. Let's do that now.
Right-click on the tree structure in the Dashboards section and click "Add New Dashboard" from the menu. This will create a blank slate to which you can add panels by right-clicking, as in the gif below.

From there, choose the System Health panel type. This will gather health information for all your Linux and Windows systems. For a single panel with all five metrics on it, make sure to use the checkboxes to select every metric. In our example, we also turn on column headers to add context to the data the panel pulls in. Once you've customized your dashboard panel to your liking, you can save your changes.
Note that you can add more than one dashboard panel to a dashboard. We encourage you to add as many as you want to adequately convey information about your critical systems. One of the following daily lessons is entirely dedicated to the Dashboards section of FrameFlow and its unique and powerful panels, so we won't elaborate any more right now.
Reports
FrameFlow's robust Reports section is home to completely customizable reports on various IT monitoring metrics. Here, you can receive up-to-date reports on the daily functions of your various event monitors and devices. Let's create a report that draws in data from our System Health monitor.
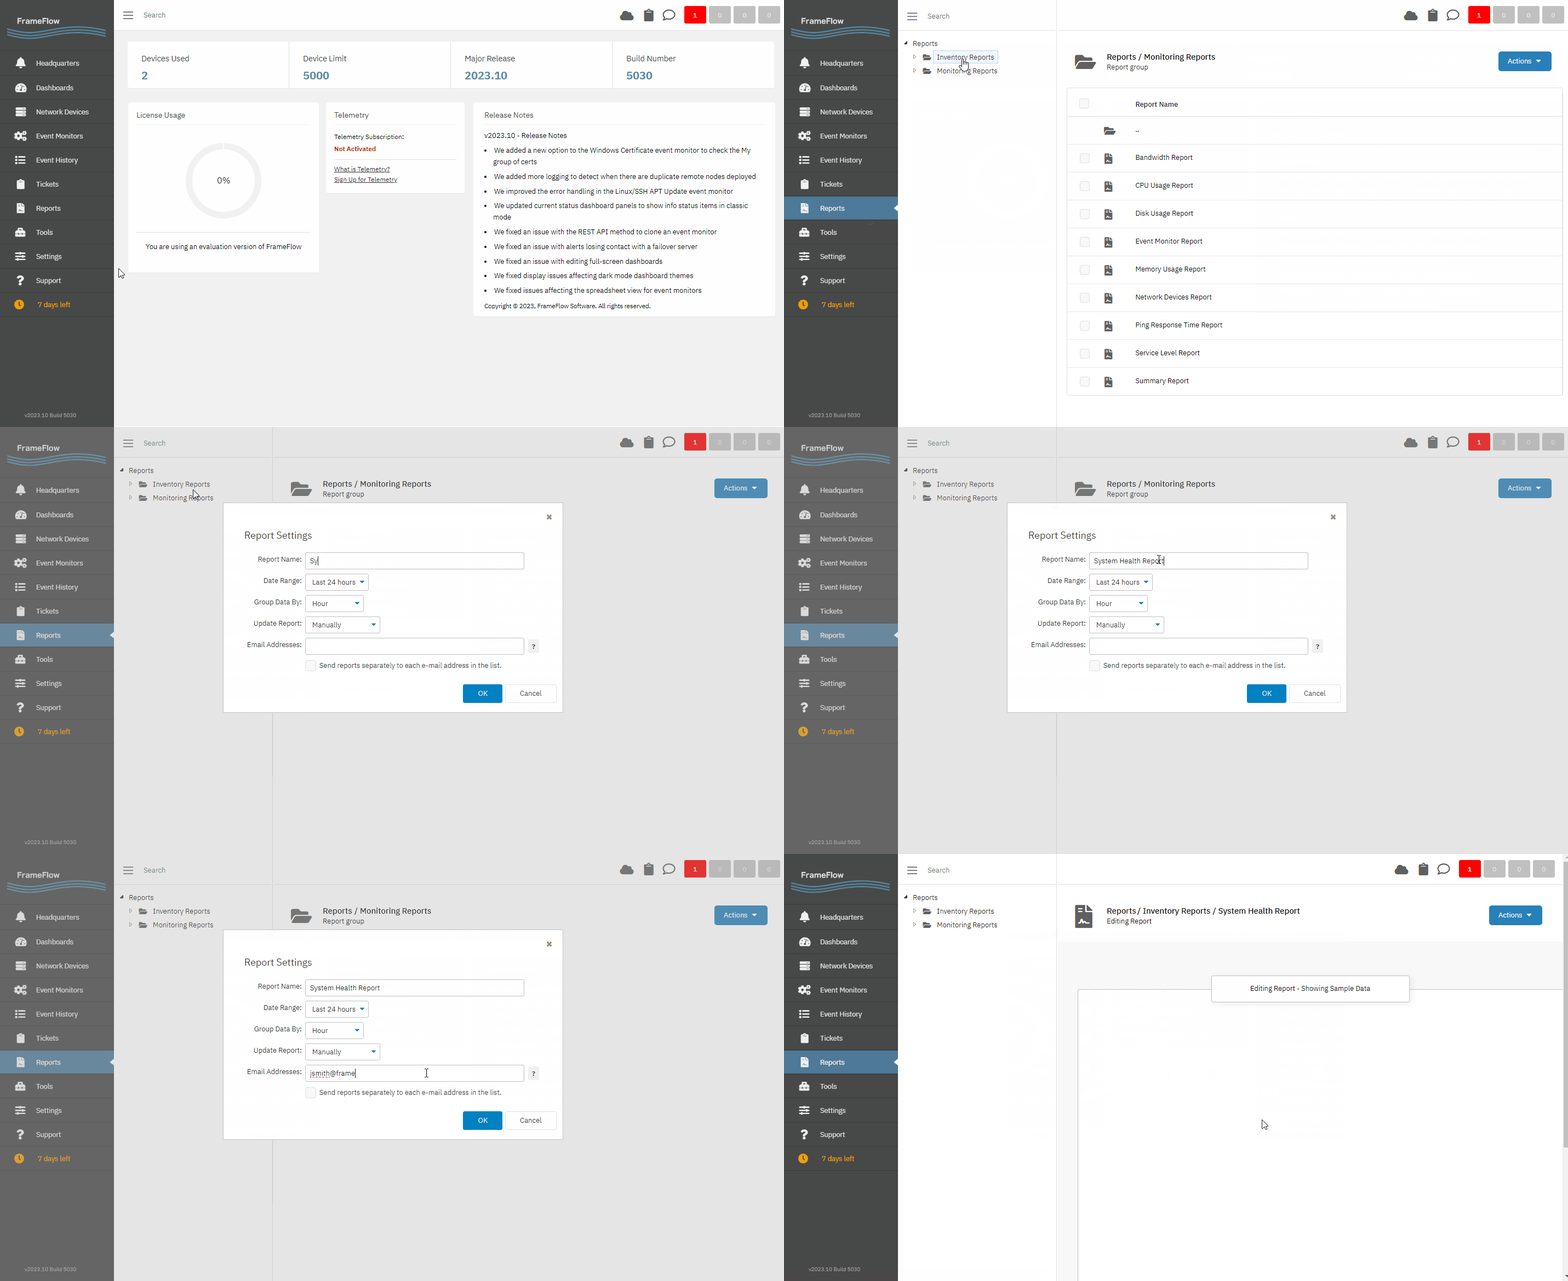
Navigate to FrameFlow's Reports section and right-click on the tree structure to reveal the option to add a new report. From there, enter the name of your report, choose its date range, grouping options, and whether or not you want the report to update automatically. Enter a comma-separated list of the email addresses you'd like the report to be sent to each time it runs. After clicking "Okay", you'll have a brand new and blank report.

Right-click anywhere on the blank report and select "Add Report Element" to reveal the chooser below. The report element we're focusing on today takes in system health data and displays it in graphical format: the Graph Table element. Choose that type from the menu shown below.

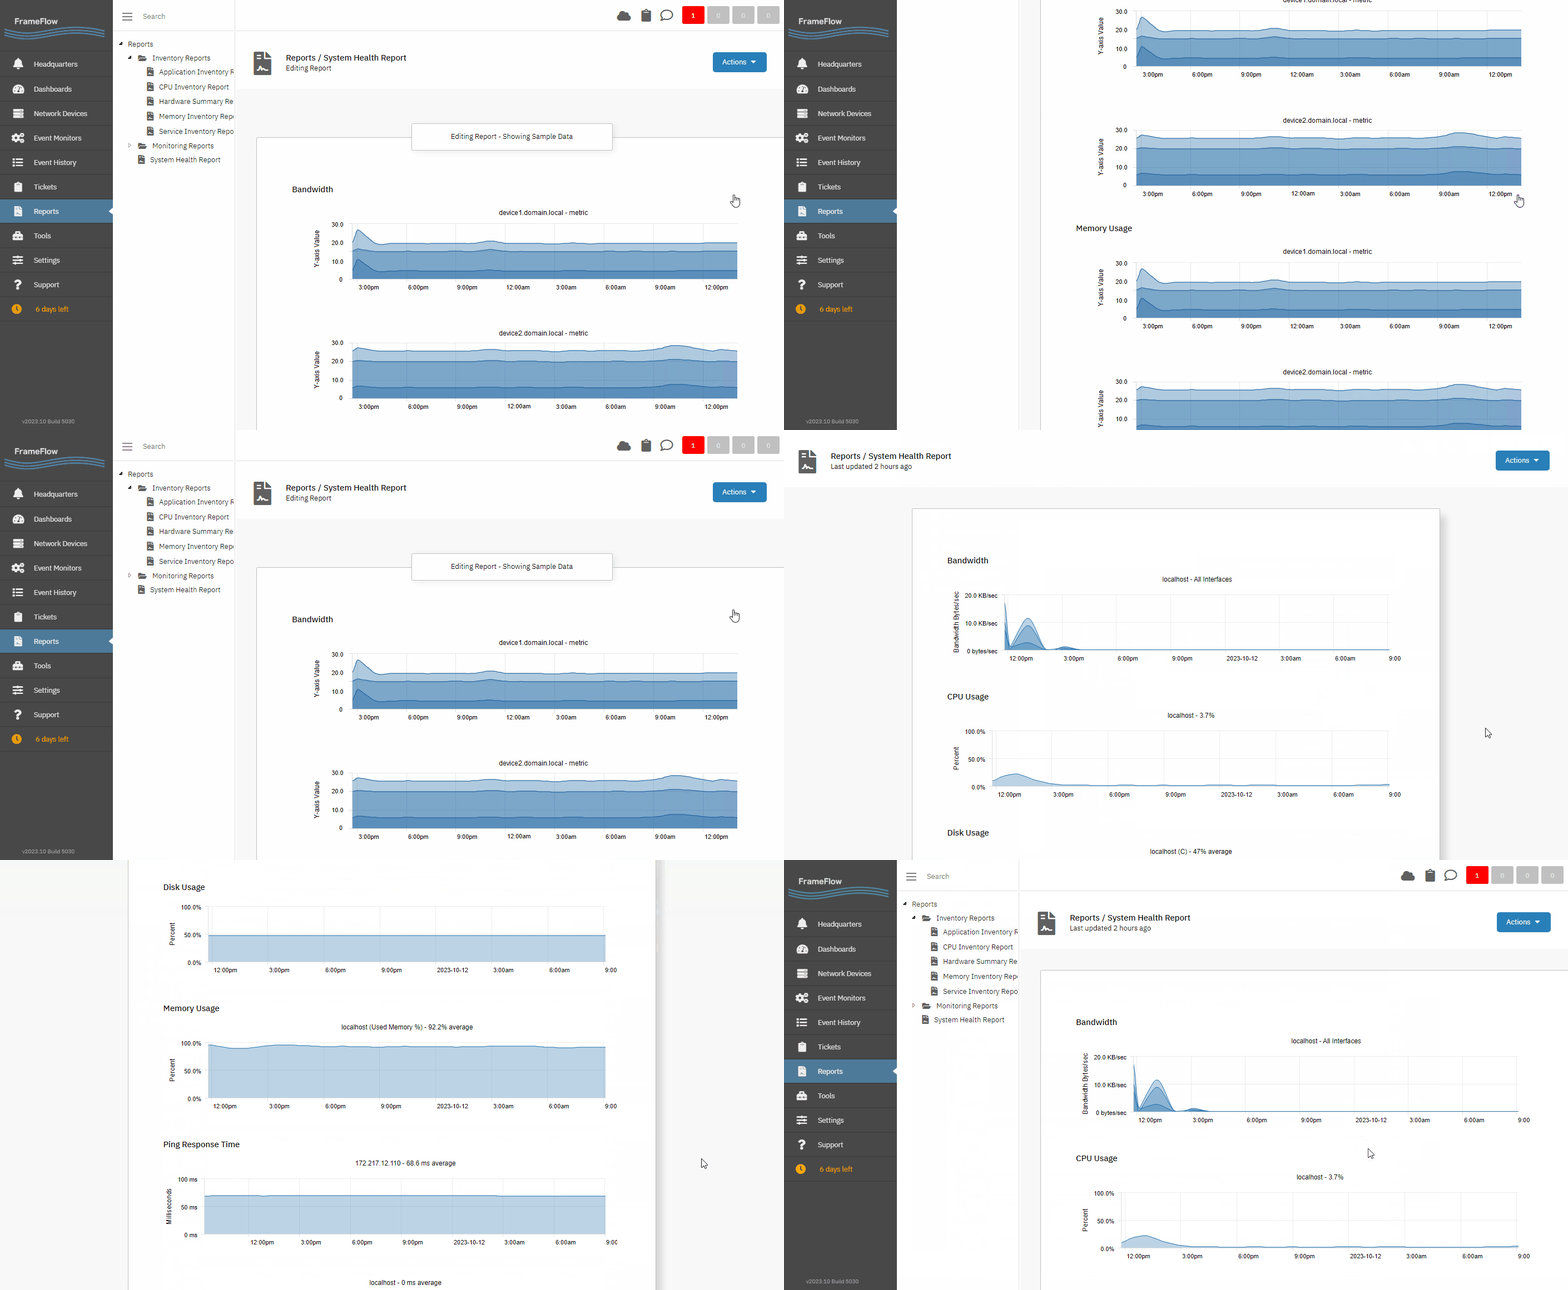
We'll be creating one of these graph tables for each system health metric, starting with bandwidth. In the Graph Table Settings, name this one "Bandwidth" and customize the title and subtitle if desired. By default, the graph type will be set to "Bandwidth In/Out/Total". For subsequent graph tables, just change the name and graph type to match the other metrics. There are additional event monitor and network device inclusion/exclusion settings and settings that control the way your graph looks as well. After you create your initial report element, repeat these steps for the other four system health metrics.
When you're satisfied with the layout of your report, use the Actions menu to build the report with your system health data. Because this report contains all five metrics, it might be helpful to view it fullscreen. To do this, right-click on the report and select "View Full Screen". You can exit fullscreen mode using the same method.

Summary
As you can see, the System Health Event Monitor is a must-have in any organization's monitoring setup. Data from your System Health Event Monitors populates dashboards, graphs, and reports throughout the interface that showcase your data in straightforward and informative ways. Make sure to include a System Health Event Monitor in your monitoring configuration to take advantage of all these benefits.
| Day 6: Security | Day 8: Event Monitor Categories |
Table of Contents
Back to Menu
Day 1: Intro and Installation
Day 2: FrameFlow's Interface
Day 3: Network Devices
Day 4: Your First Event Monitors
Day 5: Authentication Profiles
Day 6: Security
Day 7: System Health Event Monitor
Day 8: Event Monitors by Category
Day 9: Headquarters
Day 10: Dashboards
Day 11: Alert Types
Day 12: PowerShell Scripting
Day 13: Event History
Day 14: Reports and Inventory Monitoring
Day 15: Network Monitoring
Day 16: Cloud Service Monitoring
Day 17: Cloud Cost Monitoring
Day 18: Activity Monitoring
Day 19: Maintenance Windows
Day 20: Dependencies
Day 21: VMware Monitoring
Day 22: Benefits of Organization
Day 23: Assigning Device Types
Day 24: Security Best Practices
Day 25: Database Monitoring
Day 26: Hardware Monitoring
Day 27: Installation Health Event Monitor
Day 28: Multi-Site and Remote Nodes
Day 29: Failover Monitoring
Day 30: More FrameFlow Resources