Day 4: First Event Monitors
30 Days of FrameFlow
Your First Event Monitors
FrameFlow offers over one hundred specialized event monitors, providing customized alerts about suboptimal conditions in your monitoring environment ASAP. Each of these event monitors has unique settings tailored to their monitoring purposes. Please take some time today after reading this entry to familiarize yourself with the event monitors we offer and keep in mind the ones that will benefit your organization. Today, we'll go through the steps necessary to install a simple but crucial event monitor: the Ping Event Monitor.
By starting with a simple example, we'll teach you the core principles required to set up any of our event monitors. Each monitor has a unique tutorial that goes into depth on configuration for each event monitor, so make sure to seek those out for further reading. For now, though, let's return our attention to configuring a simple Ping Event Monitor.
Setting Up a Ping Event Monitor
To begin setting up a Ping Event Monitor, go to the Event Monitors section of FrameFlow. The next steps are dependent on your having at least one network device, so make sure you've met this criterion first. Steps for adding your first devices can be found in yesterday's section.
Once you're in the Event Monitors section, right-click on the Default Group and select "Add Event Monitor". Use the search to select the Ping Event Monitor as below:

Now, it's time to configure your new ping monitor. Your first step is to add one or more network devices using the device chooser. Under "Ping Event Monitor Settings", you'll see some settings that will help you control how your new event monitor behaves. FrameFlow will sample ping the exact number of times you specify in the "Ping Count" settings and will continue trying to test ping according to the ping timeout and TTL that you enter. Choose the level of alert you want to receive if FrameFlow cannot resolve the device name to an IP address.

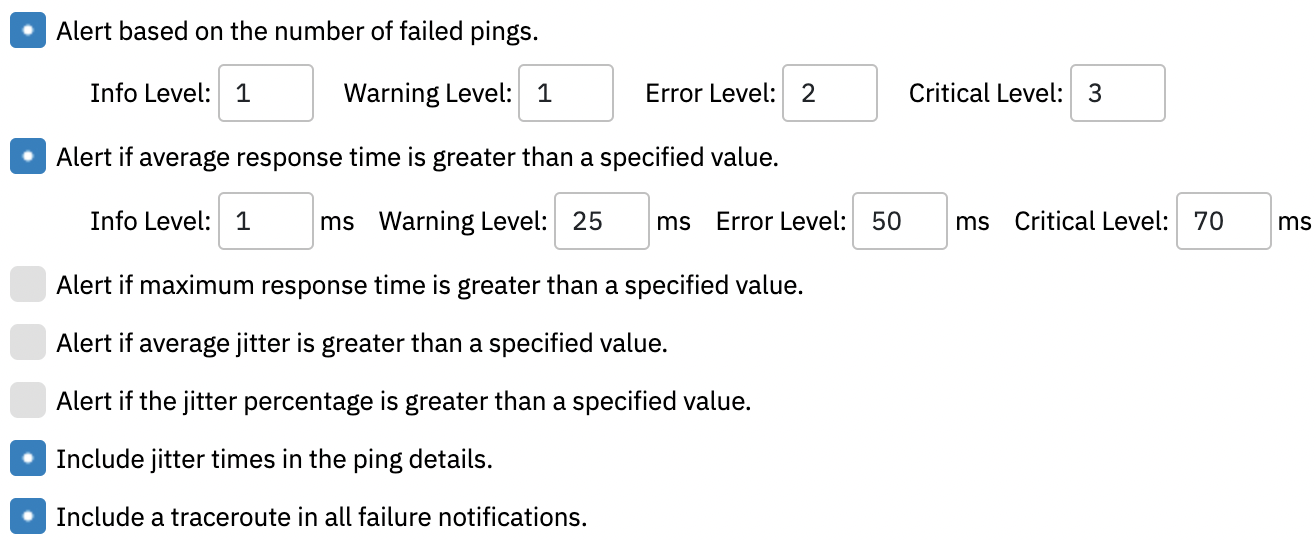
Below these settings are some more advanced options. You can receive alerts based on the average or maximum ping response time out of all the ping samples taken by the event monitor. There are also options to monitor jitter. Feel free to enable and disable options based on the information that's relevant to your monitoring purposes.

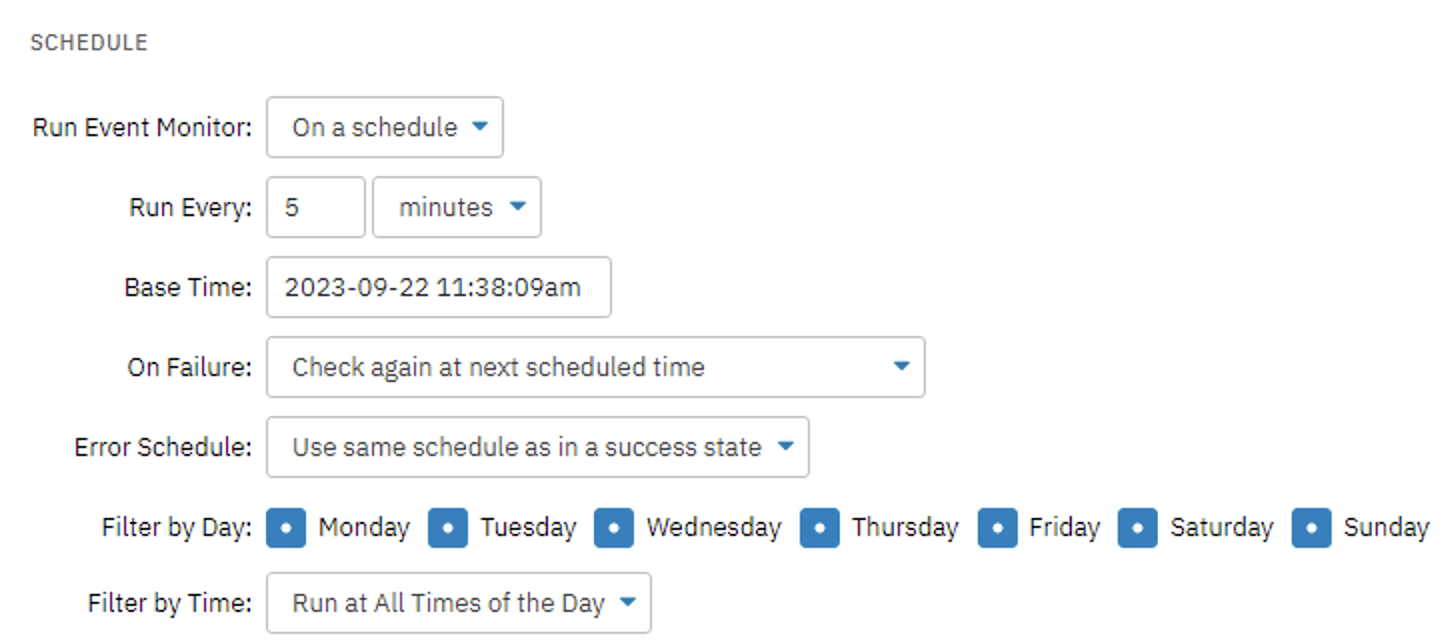
Once you've configured the monitoring settings to your needs, we can move on to the monitoring schedule. Here, you get to choose whether you'd like to run your event monitor manually or schedule event monitor runs automatically. For the Ping Event Monitor, it makes sense to sample ping once every few minutes to gather data and ensure your network is constantly flowing.

As in the image above, you can filter by day and time as well. You can use these settings to include or exclude days from monitoring and to set periods of time that the event monitor will run. Leaving these settings at their default, as above, means that this Ping Event Monitor will run once every five minutes around the clock.
In the Notifications section, select "1: Write to Event History" for now. We'll talk more about notification profiles at a later date.
Event Monitor Results
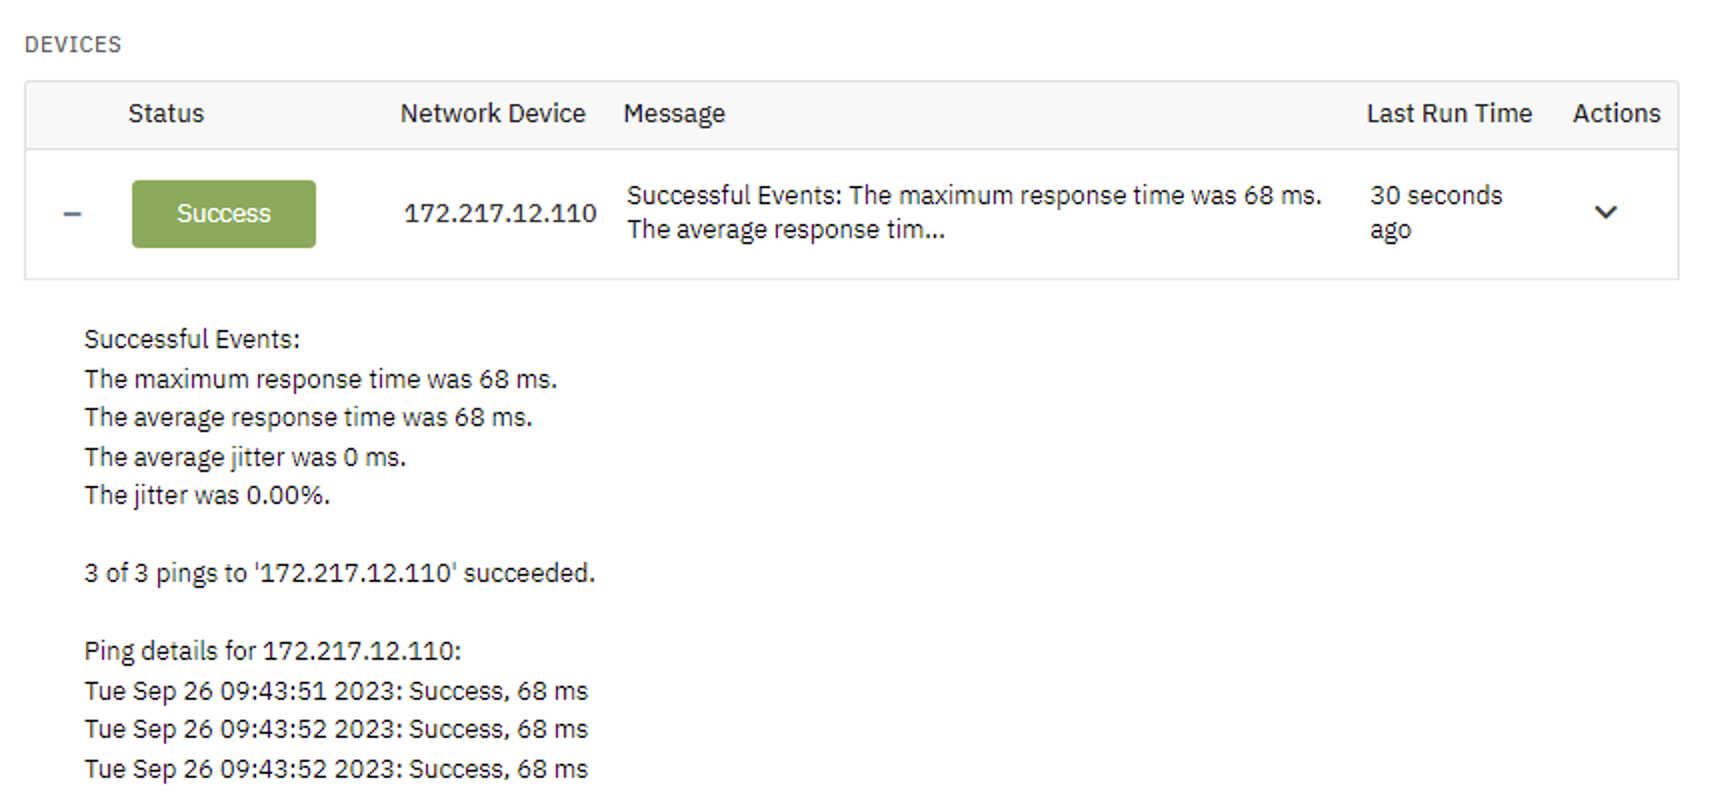
Once you've configured your event monitor to your specifications, scroll to the bottom of the Ping Event Monitor's settings and hit "Save Changes". The event monitor will immediately begin monitoring on the selected schedule. Navigate to your ping monitor's Status section to view its current status and the latest event monitor results.

Let's look at the result from the above GIF in more detail. As you can see, the event monitor results contain information about the status of your event monitor and the results of all its checks.

Event monitor results are generated each time your monitor runs. You can view past results in the Event History tab, next to the Status section.
Summary
As we move on to more advanced monitoring topics in the following days, we'll need higher levels of security than what we've been working with presently. Tomorrow and the next day, we'll show you how to optimize security and authentication to keep your FrameFlow instance and its data locked down.
| Day 3: Network Devices | Day 5: FrameFlow's Interface |
Table of Contents
Back to Menu
Day 1: Intro and Installation
Day 2: FrameFlow's Interface
Day 3: Network Devices
Day 4: Your First Event Monitors
Day 5: Authentication Profiles
Day 6: Security
Day 7: System Health Event Monitor
Day 8: Event Monitors by Category
Day 9: Headquarters
Day 10: Dashboards
Day 11: Alert Types
Day 12: PowerShell Scripting
Day 13: Event History
Day 14: Reports and Inventory Monitoring
Day 15: Network Monitoring
Day 16: Cloud Service Monitoring
Day 17: Cloud Cost Monitoring
Day 18: Activity Monitoring
Day 19: Maintenance Windows
Day 20: Dependencies
Day 21: VMware Monitoring
Day 22: Benefits of Organization
Day 23: Assigning Device Types
Day 24: Security Best Practices
Day 25: Database Monitoring
Day 26: Hardware Monitoring
Day 27: Installation Health Event Monitor
Day 28: Multi-Site and Remote Nodes
Day 29: Failover Monitoring
Day 30: More FrameFlow Resources