Day 27: Installation Health Event Monitor
30 Days of FrameFlow
About the Installation Health Event Monitor
By now, you know that FrameFlow is a versatile tool that monitors virtually any network device and gathers data. You'll have added network devices to your configuration, created event monitors, and received alerts and information about your IT environment. But there's one thing left to monitor: FrameFlow itself.
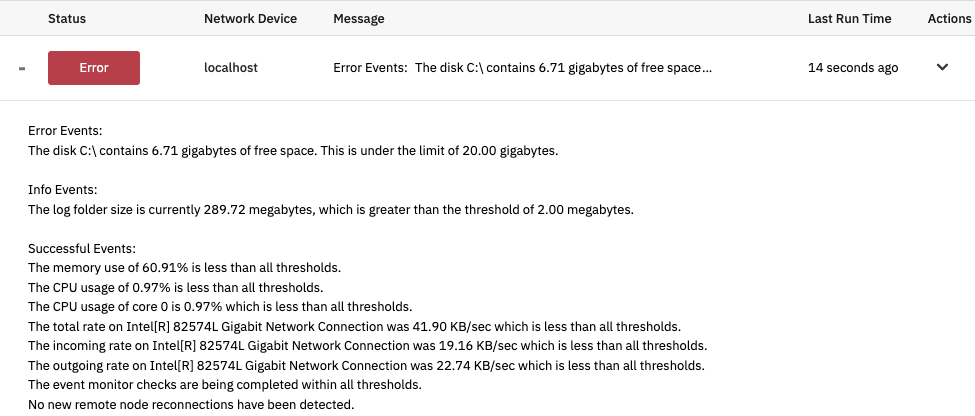
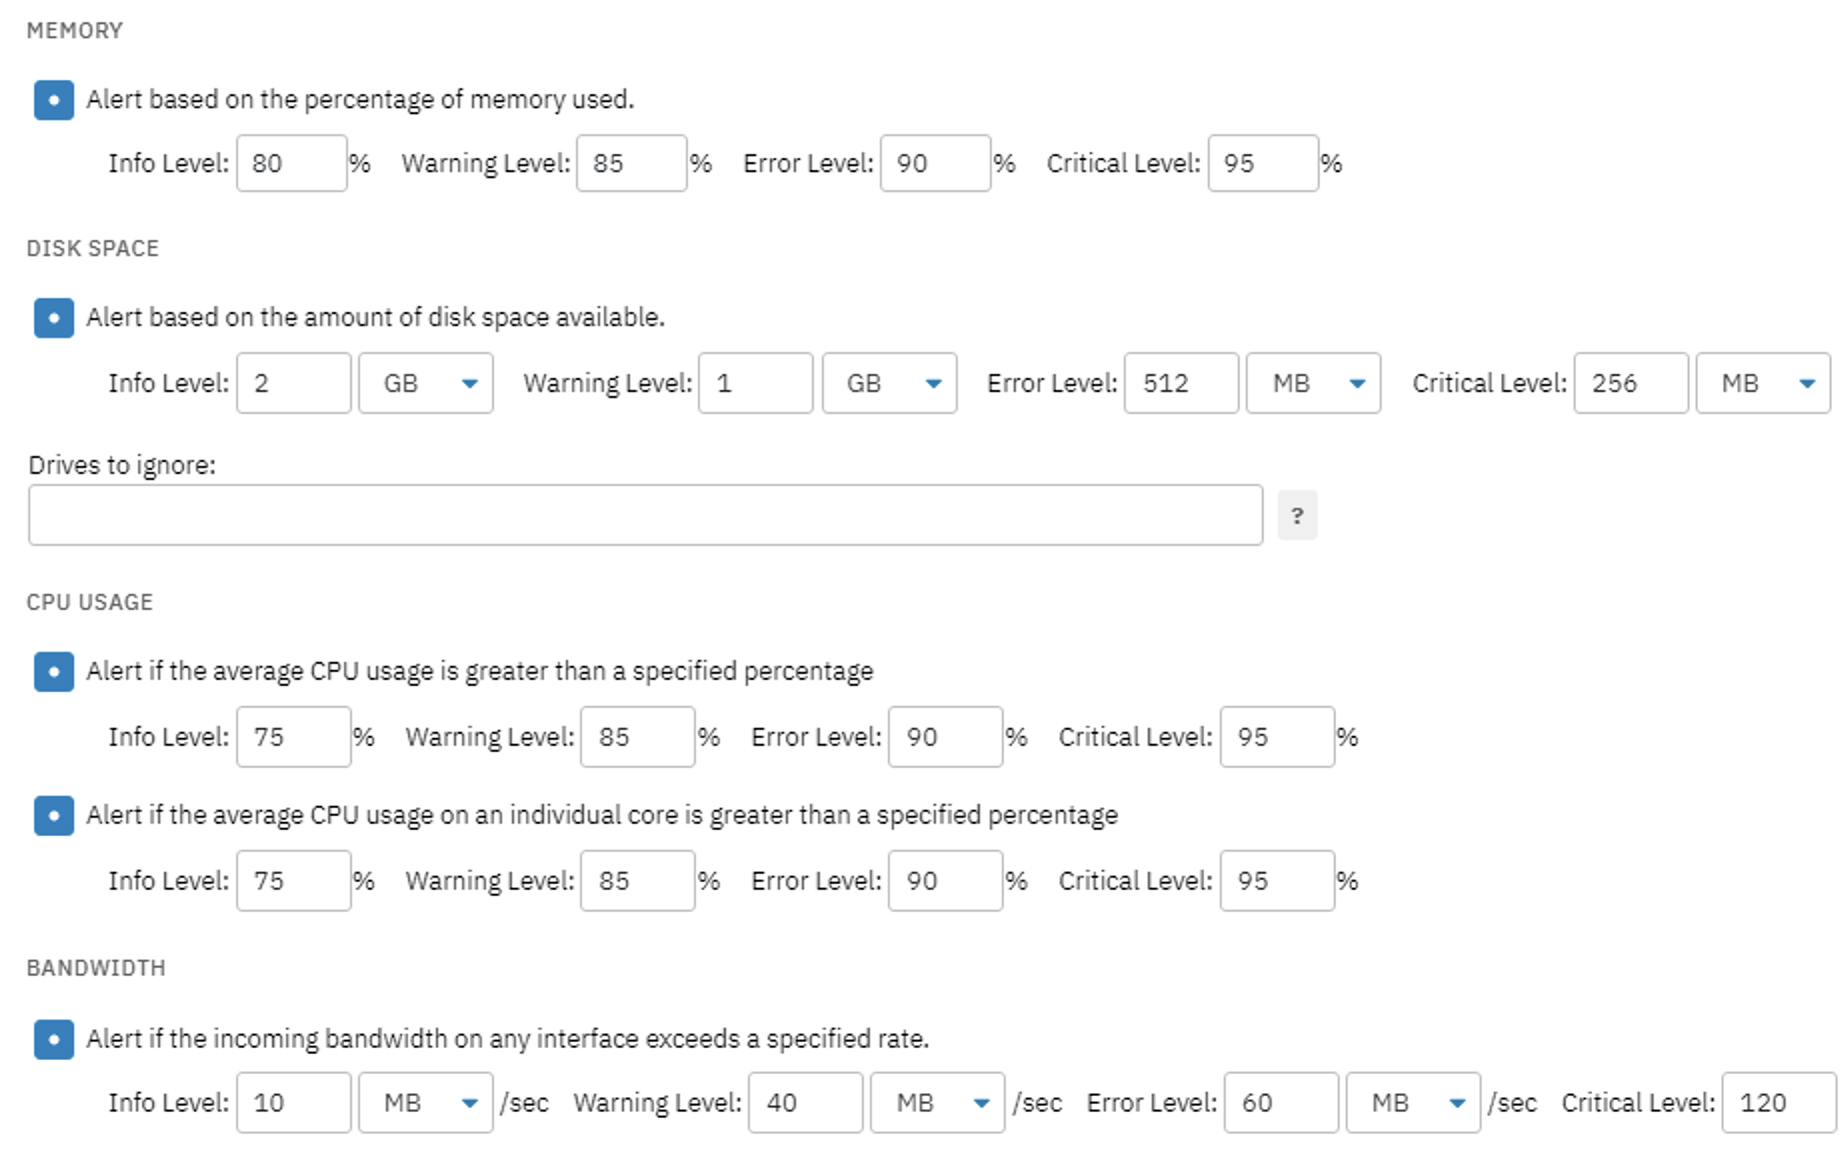
The Installation Health Event Monitor watches over the system you've installed FrameFlow on. It monitors CPU usage, bandwidth, disk space, and memory for the system where FrameFlow is installed and sends alerts around the clock about adverse conditions. This way, you can address issues when they arise to avoid interruptions to FrameFlow's monitoring.

Monitoring Installation Health Metrics
The Installation Health Event Monitor has three separate bandwidth monitoring options so you can get a well-rounded view of operations. This event monitor measures and alerts on incoming, outgoing, and total bandwidth on all interfaces.

Monitoring Queue and Remote Node Options
This event monitor provides an option to receive an alert of your choice if items in your monitoring queue are taking an excessively long time to complete. Tomorrow, we'll go over multi-site monitoring and remote nodes. For now, we'll mention that there are also two multi-site-specific alerting options as well. You can get alerts if the update service for remote nodes isn't running and receive notifications based on how long it takes for data to be posted from the remote nodes to the master console. Keep these options in mind for later when you've got multi-site mode up and running!

Under "Interfaces to Ignore", you can enter a comma-separated list of interfaces you want the event monitor to skip over. If you don't know the exact names of the interfaces you want to ignore, run the event monitor once with this field blank. In the event history, you'll find a complete list of interfaces on the system you're running FrameFlow on that you can then use to fill in this field.

Summary
With the Installation Health Event Monitor, you can ensure that your FrameFlow instance stays up and running to avoid interruptions in your monitoring. Keep an eye out for Day 29, where we create a failover server to ensure that even if the system running FrameFlow experiences failures or disruptions, monitoring can continue seamlessly.
| Day 26: Hardware Monitoring | Day 28: Multi-Site Mode |
Table of Contents
Back to Menu
Day 1: Intro and Installation
Day 2: FrameFlow's Interface
Day 3: Network Devices
Day 4: Your First Event Monitors
Day 5: Authentication Profiles
Day 6: Security
Day 7: System Health Event Monitor
Day 8: Event Monitors by Category
Day 9: Headquarters
Day 10: Dashboards
Day 11: Alert Types
Day 12: PowerShell Scripting
Day 13: Event History
Day 14: Reports and Inventory Monitoring
Day 15: Network Monitoring
Day 16: Cloud Service Monitoring
Day 17: Cloud Cost Monitoring
Day 18: Activity Monitoring
Day 19: Maintenance Windows
Day 20: Dependencies
Day 21: VMware Monitoring
Day 22: Benefits of Organization
Day 23: Assigning Device Types
Day 24: Security Best Practices
Day 25: Database Monitoring
Day 26: Hardware Monitoring
Day 27: Installation Health Event Monitor
Day 28: Multi-Site and Remote Nodes
Day 29: Failover Monitoring
Day 30: More FrameFlow Resources