Day 25: Database Monitoring
30 Days of FrameFlow
Database Monitoring with FrameFlow
FrameFlow has robust support for database monitoring. With our list of dedicated database monitors, you can do much more than just monitoring and alerting. You can also keep up-to-date lists on the size and contents of performance logs, parse for specific lines of text, and run SQL statements straight from your event monitors. To learn more, let's dive in by exploring the SQL Server Event Monitor.
Database Size Monitoring
The SQL Server Event Monitor keeps an eye on all aspects of your SQL databases, gathers data, and sends alerts about their statuses. You can monitor the size and percentage full of all databases and transaction logs, setting custom thresholds for each alert. Additional options let you single out important databases and transaction logs to monitor with separate settings from the generalized options. This helps you keep track of your most pertinent database information separately and customize your alert settings to fit them best.

Monitoring Database Contents
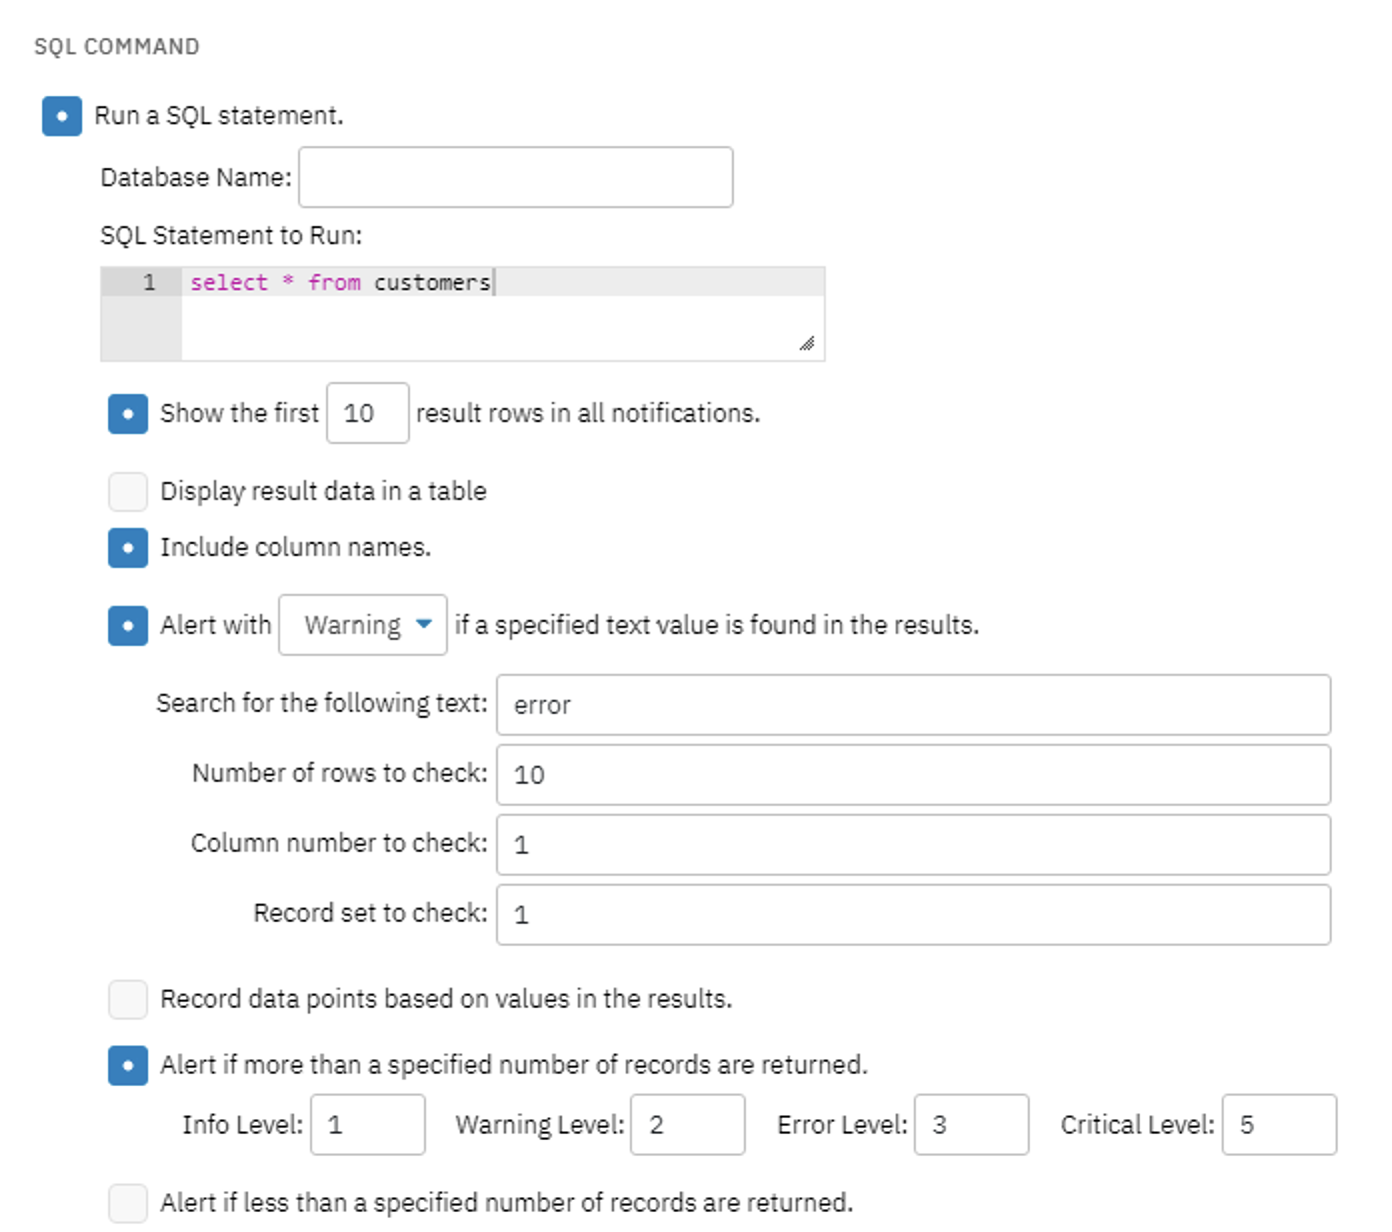
Each SQL Server Event Monitor also lets you input a custom SQL statement that will run each time the event monitor does. From there, you can display the resulting data gathered by your SQL statement in a table, receive alerts about the number of records returned by the statement, and even search through the results for specific lines of text. This last option helps you parse for specific errors or codes that are especially relevant to your monitoring.

Summary
Today's lesson focused on the SQL Server Event Monitor, but similar options are available for Oracle monitoring and any other database through the ODBC protocol. Make sure to explore these event monitors as well and add them to your setup if they're relevant to your monitoring goals. Tomorrow, we'll tackle hardware monitoring, so stay tuned!
| Day 24: Security Best Practices | Day 26: Hardware Monitoring |
Table of Contents
Back to Menu
Day 1: Intro and Installation
Day 2: FrameFlow's Interface
Day 3: Network Devices
Day 4: Your First Event Monitors
Day 5: Authentication Profiles
Day 6: Security
Day 7: System Health Event Monitor
Day 8: Event Monitors by Category
Day 9: Headquarters
Day 10: Dashboards
Day 11: Alert Types
Day 12: PowerShell Scripting
Day 13: Event History
Day 14: Reports and Inventory Monitoring
Day 15: Network Monitoring
Day 16: Cloud Service Monitoring
Day 17: Cloud Cost Monitoring
Day 18: Activity Monitoring
Day 19: Maintenance Windows
Day 20: Dependencies
Day 21: VMware Monitoring
Day 22: Benefits of Organization
Day 23: Assigning Device Types
Day 24: Security Best Practices
Day 25: Database Monitoring
Day 26: Hardware Monitoring
Day 27: Installation Health Event Monitor
Day 28: Multi-Site and Remote Nodes
Day 29: Failover Monitoring
Day 30: More FrameFlow Resources