Day 21: VMware Monitoring
30 Days of FrameFlow
Monitoring VMware with FrameFlow
FrameFlow offers 5 event monitors that are specialized to help monitor your VMware VMs. From VMware host health to snapshot monitoring, FrameFlow has a tool for your VMware monitoring needs. Today, we'll explore each of our VMware event monitors briefly. For more details, visit our Technical Resources section.
Bandwidth, Disk, and CPU Monitoring
FrameFlow watches three key metrics for your VMware virtual machines: bandwidth, CPU usage, and disk space. FrameFlow can detect incoming, outgoing, and total bandwidth and offers options to alert if any exceed specified values. We can also measure and alert about both CPU usage and CPU readiness with the VMware CPU Usage Event Monitor. Our VMware Disk Event Monitor alerts about changes in disk space and remaining disk space for all your VMs.

Together, these event monitors help ensure the health of your VMware systems. The following two event monitors cover more advanced VMware monitoring.
VMware Host Health Event Monitor
Our VMware Host Health Event Monitor watches key health metrics for your VMware hosts specifically. This event monitor will alert you about metrics like CPU usage, readiness, and ready time; disk space, memory, bandwidth, ping response times, and more. Use it to keep an eye on the all-around health of your VMware hosts.

VMware Snapshot Event Monitor
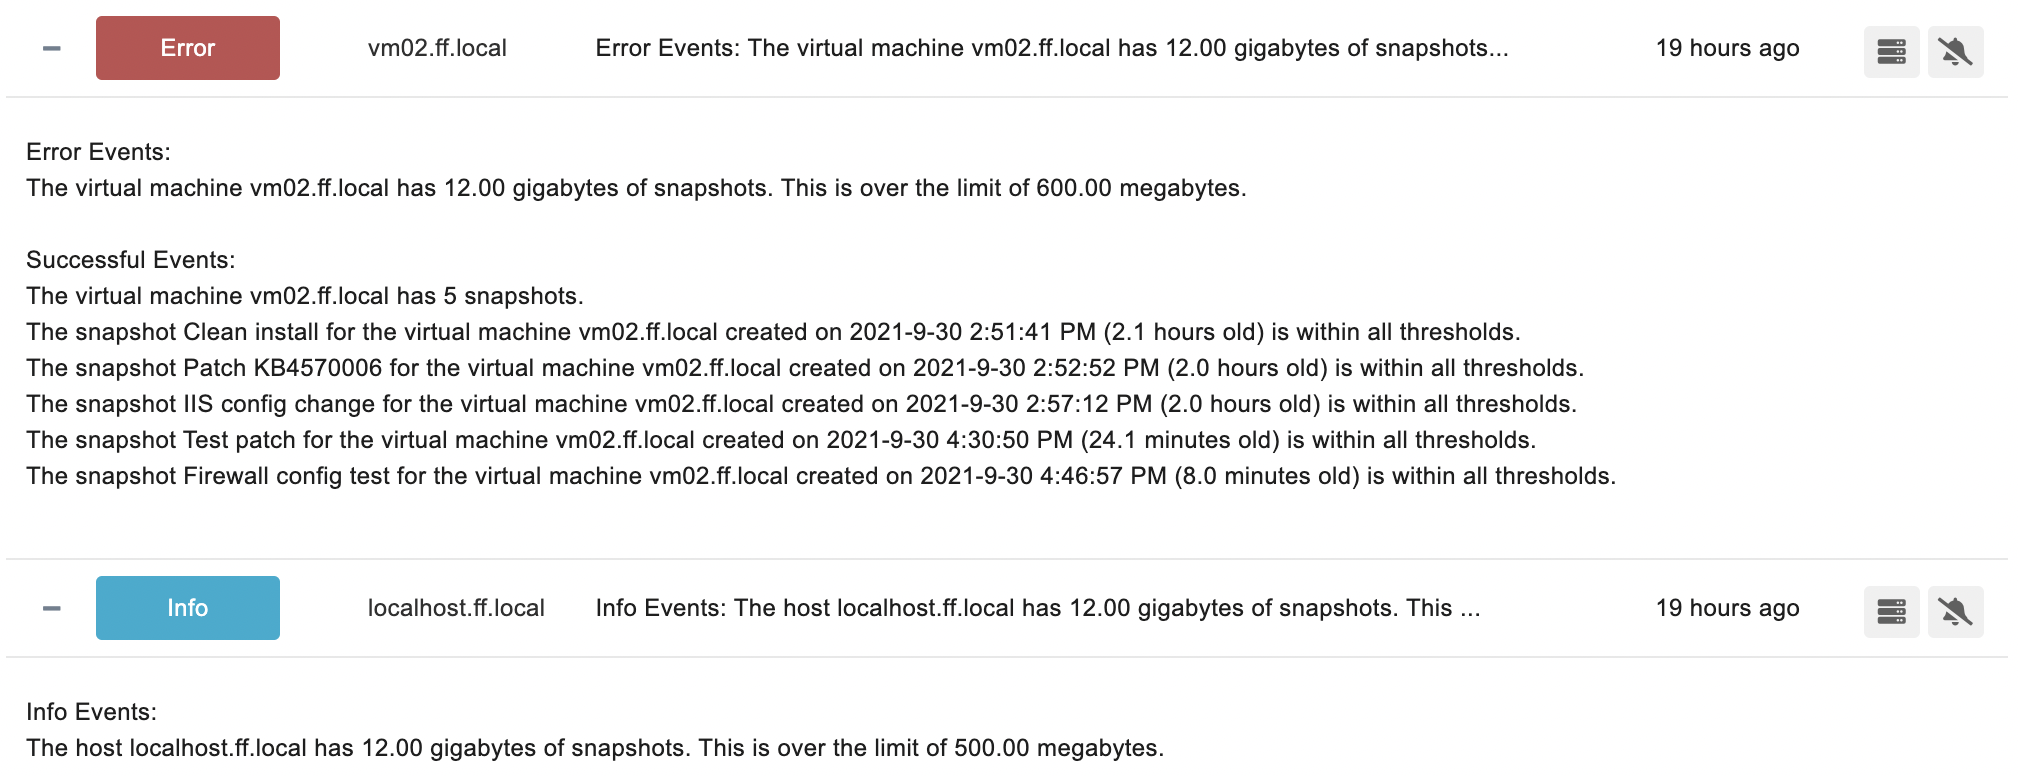
The VMware VMs Snapshot Event Monitor keeps track of the snapshot space used by guests. It alerts you if snapshots take up more than a specified amount of disk space and lets you know if the snapshots are older than a specified age. This helps you weed out old snapshots that are no longer of use and keep an eye on the overall size of your snapshots.

Summary
Now that you know about the VMware monitoring tools FrameFlow has to offer, we encourage you to explore these and other event monitors to create a configuration that works best for your organization. If you need further information on any of these event monitors, check out our Event Monitor Reference Library and scroll to the VMware monitoring section. Tomorrow, we'll learn about device types, so stay tuned!
| Day 20: Dependencies | Day 22: Organization |
Table of Contents
Back to Menu
Day 1: Intro and Installation
Day 2: FrameFlow's Interface
Day 3: Network Devices
Day 4: Your First Event Monitors
Day 5: Authentication Profiles
Day 6: Security
Day 7: System Health Event Monitor
Day 8: Event Monitors by Category
Day 9: Headquarters
Day 10: Dashboards
Day 11: Alert Types
Day 12: PowerShell Scripting
Day 13: Event History
Day 14: Reports and Inventory Monitoring
Day 15: Network Monitoring
Day 16: Cloud Service Monitoring
Day 17: Cloud Cost Monitoring
Day 18: Activity Monitoring
Day 19: Maintenance Windows
Day 20: Dependencies
Day 21: VMware Monitoring
Day 22: Benefits of Organization
Day 23: Assigning Device Types
Day 24: Security Best Practices
Day 25: Database Monitoring
Day 26: Hardware Monitoring
Day 27: Installation Health Event Monitor
Day 28: Multi-Site and Remote Nodes
Day 29: Failover Monitoring
Day 30: More FrameFlow Resources