Day 2: Introduction to FrameFlow's Interface
30 Days of FrameFlow
Introduction to the FrameFlow Interface
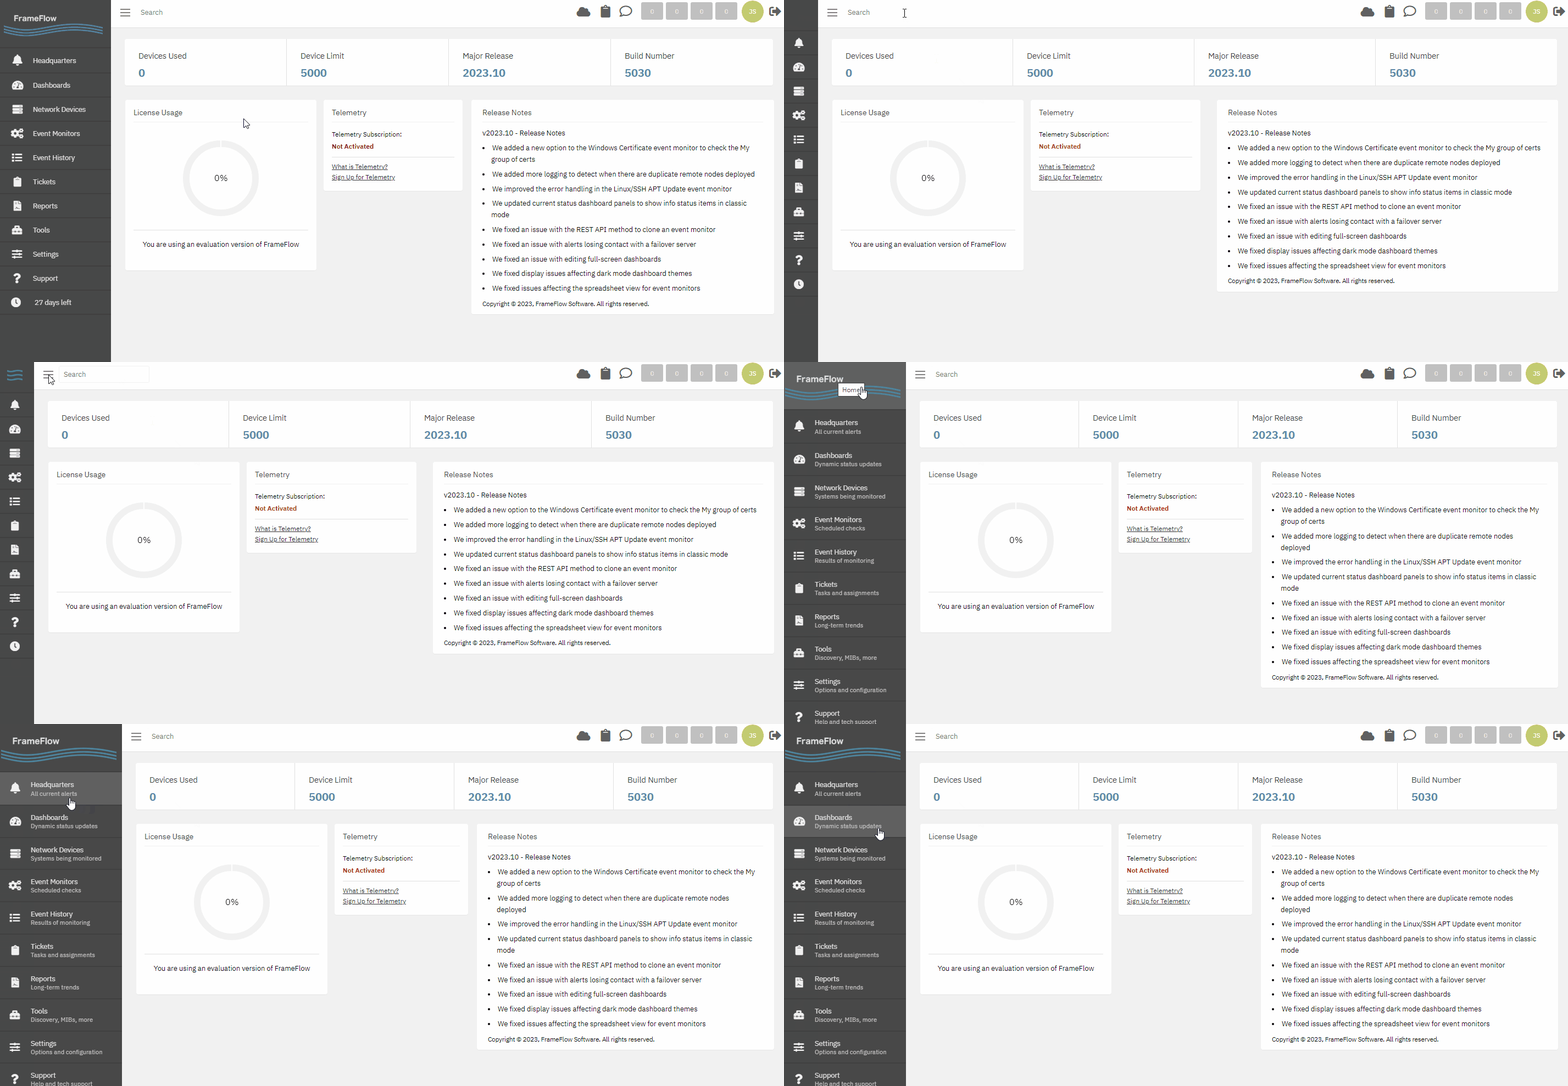
Once you've downloaded FrameFlow successfully, it's time to start exploring the interface. Upon finishing the setup process, you'll be met with the screen you see below. It keeps information about your FrameFlow license, version number, usage, and device limit handy and accessible. At the bottom, you'll see the release notes for FrameFlow's latest version.

The left sidebar is where you'll do most of your navigation. By using its hamburger icon, you can expand and collapse this section to icons only, icons and titles, or icons, titles, and descriptions as seen in the gif below. Leaving the descriptions on for now may help you familiarize yourself with FrameFlow faster.

Sections of FrameFlow
Here, we'll briefly summarize the role of each major section of FrameFlow.
Headquarters
To stay on top of network and system status, system administrators need one place where they can go to see the current list of active alerts. The Headquarters section is the real-time hub for all connected devices on your network. Here, you can see an up-to-date list of anything that may require your attention. The Headquarters section allows you to suppress and resume alerts, so you can focus on the most urgent matters and handle the rest later.
Sites
We'll go into detail on sites and Multi-Site Mode later on in the 30 days. Stay tuned!
Dashboards
The Dashboards section gives you the necessary tools to create descriptive and interactive visualizations of your monitoring setup. Mix and match over two dozen interactive dashboard elements including ones dedicated to current alerts, event monitor results, graphs, diagrams, and more. Create beautiful dashboards to convey system status and display them in your IT team's headquarters. You can even build personal dashboards for users or teams containing the exact information that's relevant to their duties.
Network Devices
Network Devices is the place to view, edit, or delete the devices you're monitoring with FrameFlow. We'll go over adding your first network devices tomorrow. After adding your network devices to Frameflow, you can begin to monitor them and receive alerts and info about their current and past conditions.
Event Monitors
Once you've got network devices, you'll need event monitors to watch them and send alerts about problematic conditions. Event monitors run tasks at regular intervals that test the health of your systems. You can set event monitors to measure bandwidth, connection speed, drive space, and much more. There are over 100 kinds of event monitors, each designed to monitor specific conditions that may arise with all types of network devices.
Event History
The Event History section is where you'll find a list showing the results of event monitoring over time. This tool is useful for tracking the history of the performance of your network devices to understand the conditions that preceded an alert or decline in performance. You can even use Event History data to establish the threshold for normal values specific to your systems. For example, maybe one of your network devices purposely consumes 100% of the available memory. Once you notice that with the help of the Event History section, you know you can safely ignore alerts about this condition and can tailor your monitoring accordingly.
Tickets
FrameFlow also comes with a built-in ticketing system that lets administrators record/assign updates and configuration changes they made as they responded to alerts. This allows multiple system administrators to stay up to date on the latest system changes, who made them, and why they happened. You can even triage tickets based on priority using values between 1 and 10.
Reports
FrameFlow's Reports section is home to completely customizable reports on various IT monitoring topics. Here, you can receive up-to-date reports on the daily functions of your event monitors and devices. Every FrameFlow installation comes with five default report types: CPU usage, memory, disk usage, ping response time, and bandwidth. You can also create custom reports.
Tools
FrameFlow's Tools section houses a selection of additional services included in a FrameFlow subscription or license. Here, you can download APIs, FrameFlow's taskbar notifier, and our remote node setup. You can also access Administration History, Device Discovery, and FrameFlow's integrated SNMP browser here.
Settings
The Settings section is your hub for viewing and changing system settings. Here, you can create or alter authentication profiles, user logins, notification settings, and much more.
Support
Clicking on the Support link at the bottom of this menu takes you here, to FrameFlow's knowledge base website. This site is where you can find technical documentation on each event monitor and articles on troubleshooting common problems.
Summary
Now that you know a little bit about each major section of our interface, take some time to explore it more before tomorrow's lesson. In the upcoming days, we'll go over each section in detail, but for now, familiarizing yourself with the layout of our interface will make for faster navigation.
| Day 1: Intro to FrameFlow | Day 3: Network Devices |
Table of Contents
Back to Menu
Day 1: Intro and Installation
Day 2: FrameFlow's Interface
Day 3: Network Devices
Day 4: Your First Event Monitors
Day 5: Authentication Profiles
Day 6: Security
Day 7: System Health Event Monitor
Day 8: Event Monitors by Category
Day 9: Headquarters
Day 10: Dashboards
Day 11: Alert Types
Day 12: PowerShell Scripting
Day 13: Event History
Day 14: Reports and Inventory Monitoring
Day 15: Network Monitoring
Day 16: Cloud Service Monitoring
Day 17: Cloud Cost Monitoring
Day 18: Activity Monitoring
Day 19: Maintenance Windows
Day 20: Dependencies
Day 21: VMware Monitoring
Day 22: Benefits of Organization
Day 23: Assigning Device Types
Day 24: Security Best Practices
Day 25: Database Monitoring
Day 26: Hardware Monitoring
Day 27: Installation Health Event Monitor
Day 28: Multi-Site and Remote Nodes
Day 29: Failover Monitoring
Day 30: More FrameFlow Resources