Day 15: Network Monitoring
30 Days of FrameFlow
Network Monitoring with FrameFlow
Your network is the backbone of your IT operations, constantly ensuring that your vital systems can communicate with each other. As such, it's critical that you maintain peak health across your network. Fortunately, your new FrameFlow installation includes several event monitors that gather and alert about crucial data from devices on your network. Today, let's learn more about network monitoring with FrameFlow.
Putting the 'Simple' Back in SNMP
One of the most advantageous things about monitoring SNMP with FrameFlow is the simplicity of our interface. Our SNMP features can be used by anyone, whether you're a beginner to SNMP or a seasoned user. From our SNMP-based event monitors to our SNMP browser, we remove the complicated parts of SNMP monitoring and display only the relevant data, so you can focus on what matters.
With FrameFlow, you can monitor important metrics like interface status, port bandwidth, and uptime on all of your switches, routers, firewalls, and other networking gear. We have deep support for SNMPv1, v2c, and v3 with dedicated event monitors, a MIB manager, and an integrated SNMP browser. Let's explore these in further depth.
SNMP Bandwidth Monitoring
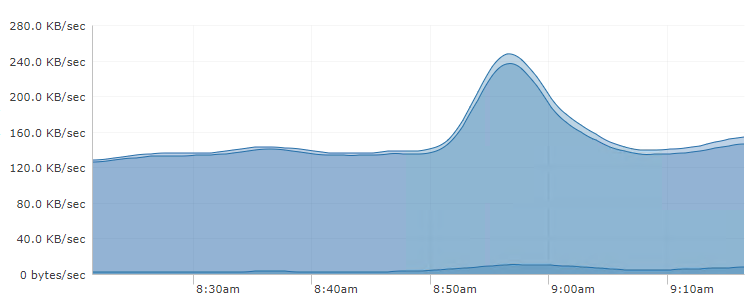
FrameFlow's SNMP Bandwidth Event Monitor keeps track of incoming, outgoing, and total bandwidth for all network devices connected to it. You'll be able to see bandwidth stats for each interface, view graphs, and receive alerts about bandwidth rates that exceed the thresholds you specify in FrameFlow. Your event monitor will collect data each time it runs and over time you'll start to see longer-term trends that you can use for monitoring, capacity planning, and more.

SNMP Interface Event Monitor
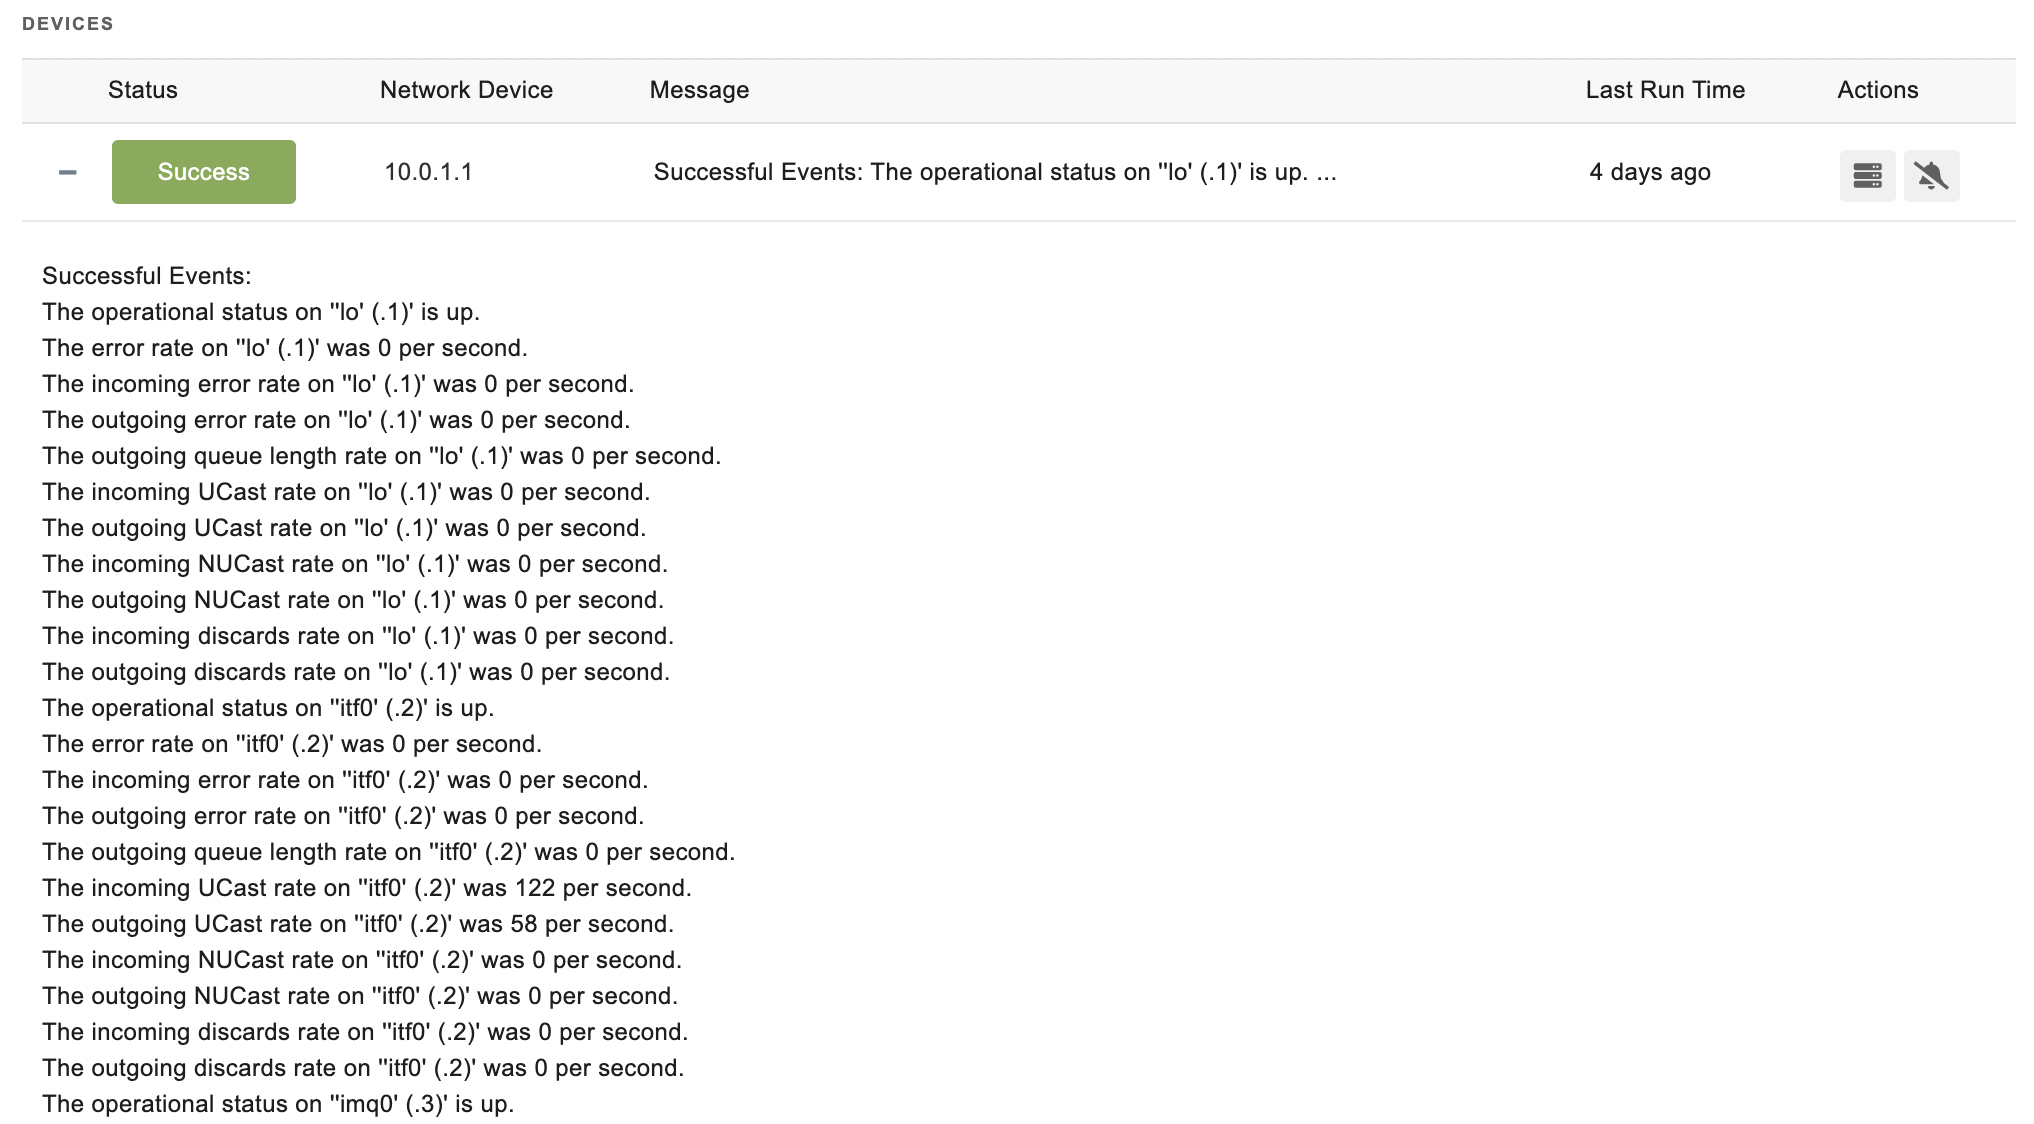
The SNMP Interface Event Monitor watches the status of your SNMP interfaces by keeping tabs on admin and oper statuses, detecting changes in connections, and monitoring error rates. This monitor will help you stay up to speed on problems that may be slowing down your connections before they cause larger issues. You can also use it to monitor queue lengths, inbound discards, outbound discards and much more.

MIB Manager and Integrated SNMP Browser
FrameFlow also offers two additional tools that help you browse and manage SNMP-related values. You can find both in the Tools section of your FrameFlow installation. Our SNMP browser scans all the SNMP devices on your network and returns all the values they support. Using the MIB manager, you can manage, test, and add new MIB files to the existing list.

Summary
Now that you know about FrameFlow's SNMP monitoring tools, you can keep an eye on all SNMP-enabled devices on your network like never before. Alongside robust SNMP interface and bandwidth monitoring, we also have SNMP browser and MIB manager tools that help you keep tabs on your SNMP devices. Tomorrow, we'll dive into cloud service monitoring, so stay tuned!
| Day 14: Reports | Day 16: Cloud Service Monitoring |
Table of Contents
Back to Menu
Day 1: Intro and Installation
Day 2: FrameFlow's Interface
Day 3: Network Devices
Day 4: Your First Event Monitors
Day 5: Authentication Profiles
Day 6: Security
Day 7: System Health Event Monitor
Day 8: Event Monitors by Category
Day 9: Headquarters
Day 10: Dashboards
Day 11: Alert Types
Day 12: PowerShell Scripting
Day 13: Event History
Day 14: Reports and Inventory Monitoring
Day 15: Network Monitoring
Day 16: Cloud Service Monitoring
Day 17: Cloud Cost Monitoring
Day 18: Activity Monitoring
Day 19: Maintenance Windows
Day 20: Dependencies
Day 21: VMware Monitoring
Day 22: Benefits of Organization
Day 23: Assigning Device Types
Day 24: Security Best Practices
Day 25: Database Monitoring
Day 26: Hardware Monitoring
Day 27: Installation Health Event Monitor
Day 28: Multi-Site and Remote Nodes
Day 29: Failover Monitoring
Day 30: More FrameFlow Resources