Day 14: IT Monitoring Reports
30 Days of FrameFlow
Getting Started with Reports
With FrameFlow, you can create custom reports that summarize the daily functions of your various event monitors and network devices. Every FrameFlow installation comes with five default report types: CPU usage, memory, disk usage, ping response time, and bandwidth. Today, we'll explore these and other reports in more depth.
Monitoring Reports
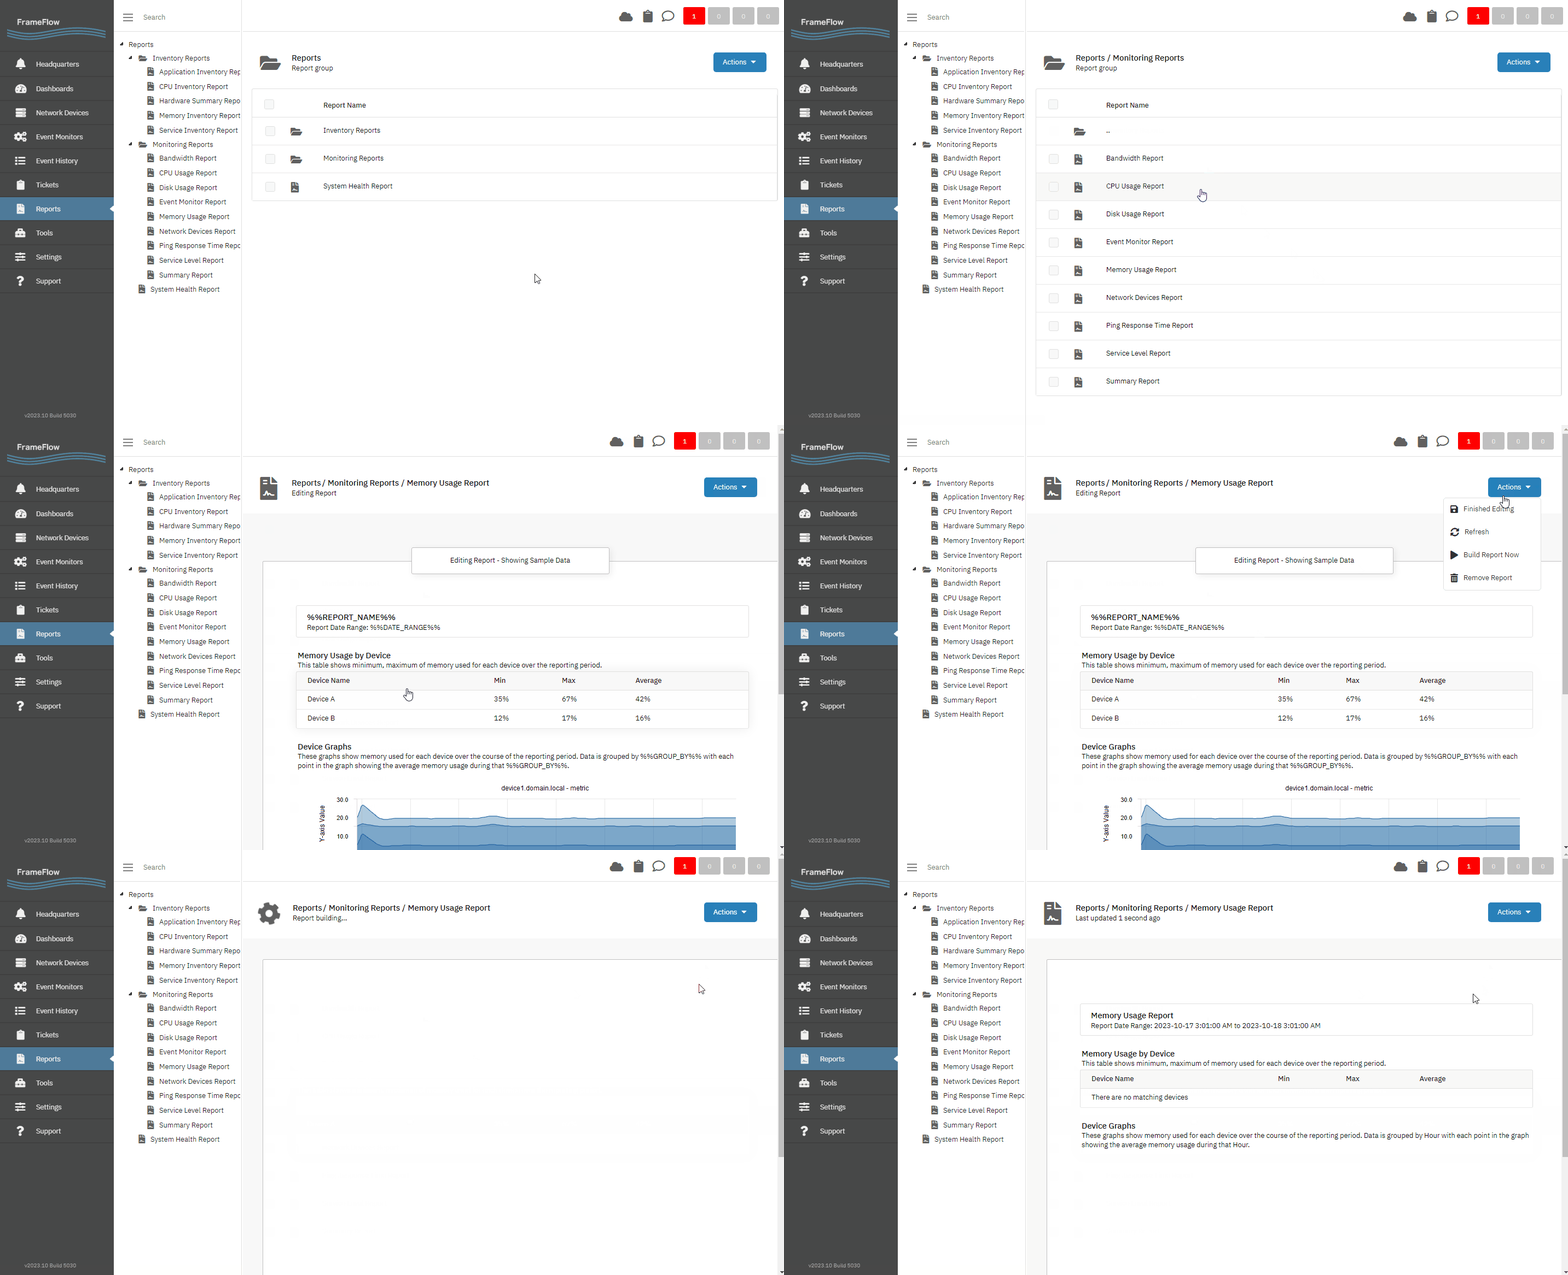
In the folder "Monitoring Reports" are some report templates you can use to learn more about your critical systems. As we mentioned on day seven when we covered the System Health Event Monitor, there are report templates for all five system health metrics. Let's build a memory usage report to get familiarized with the layout of the Reports section.
Creating a Monitoring Report
Begin by navigating to FrameFlow's Reports section. Choose the Memory Usage Report template. The information you initially see when you choose the report is sample data. To build the report with data from your monitors, use the blue Actions menu to select "Build Report Now". Your report may take a few moments to load.

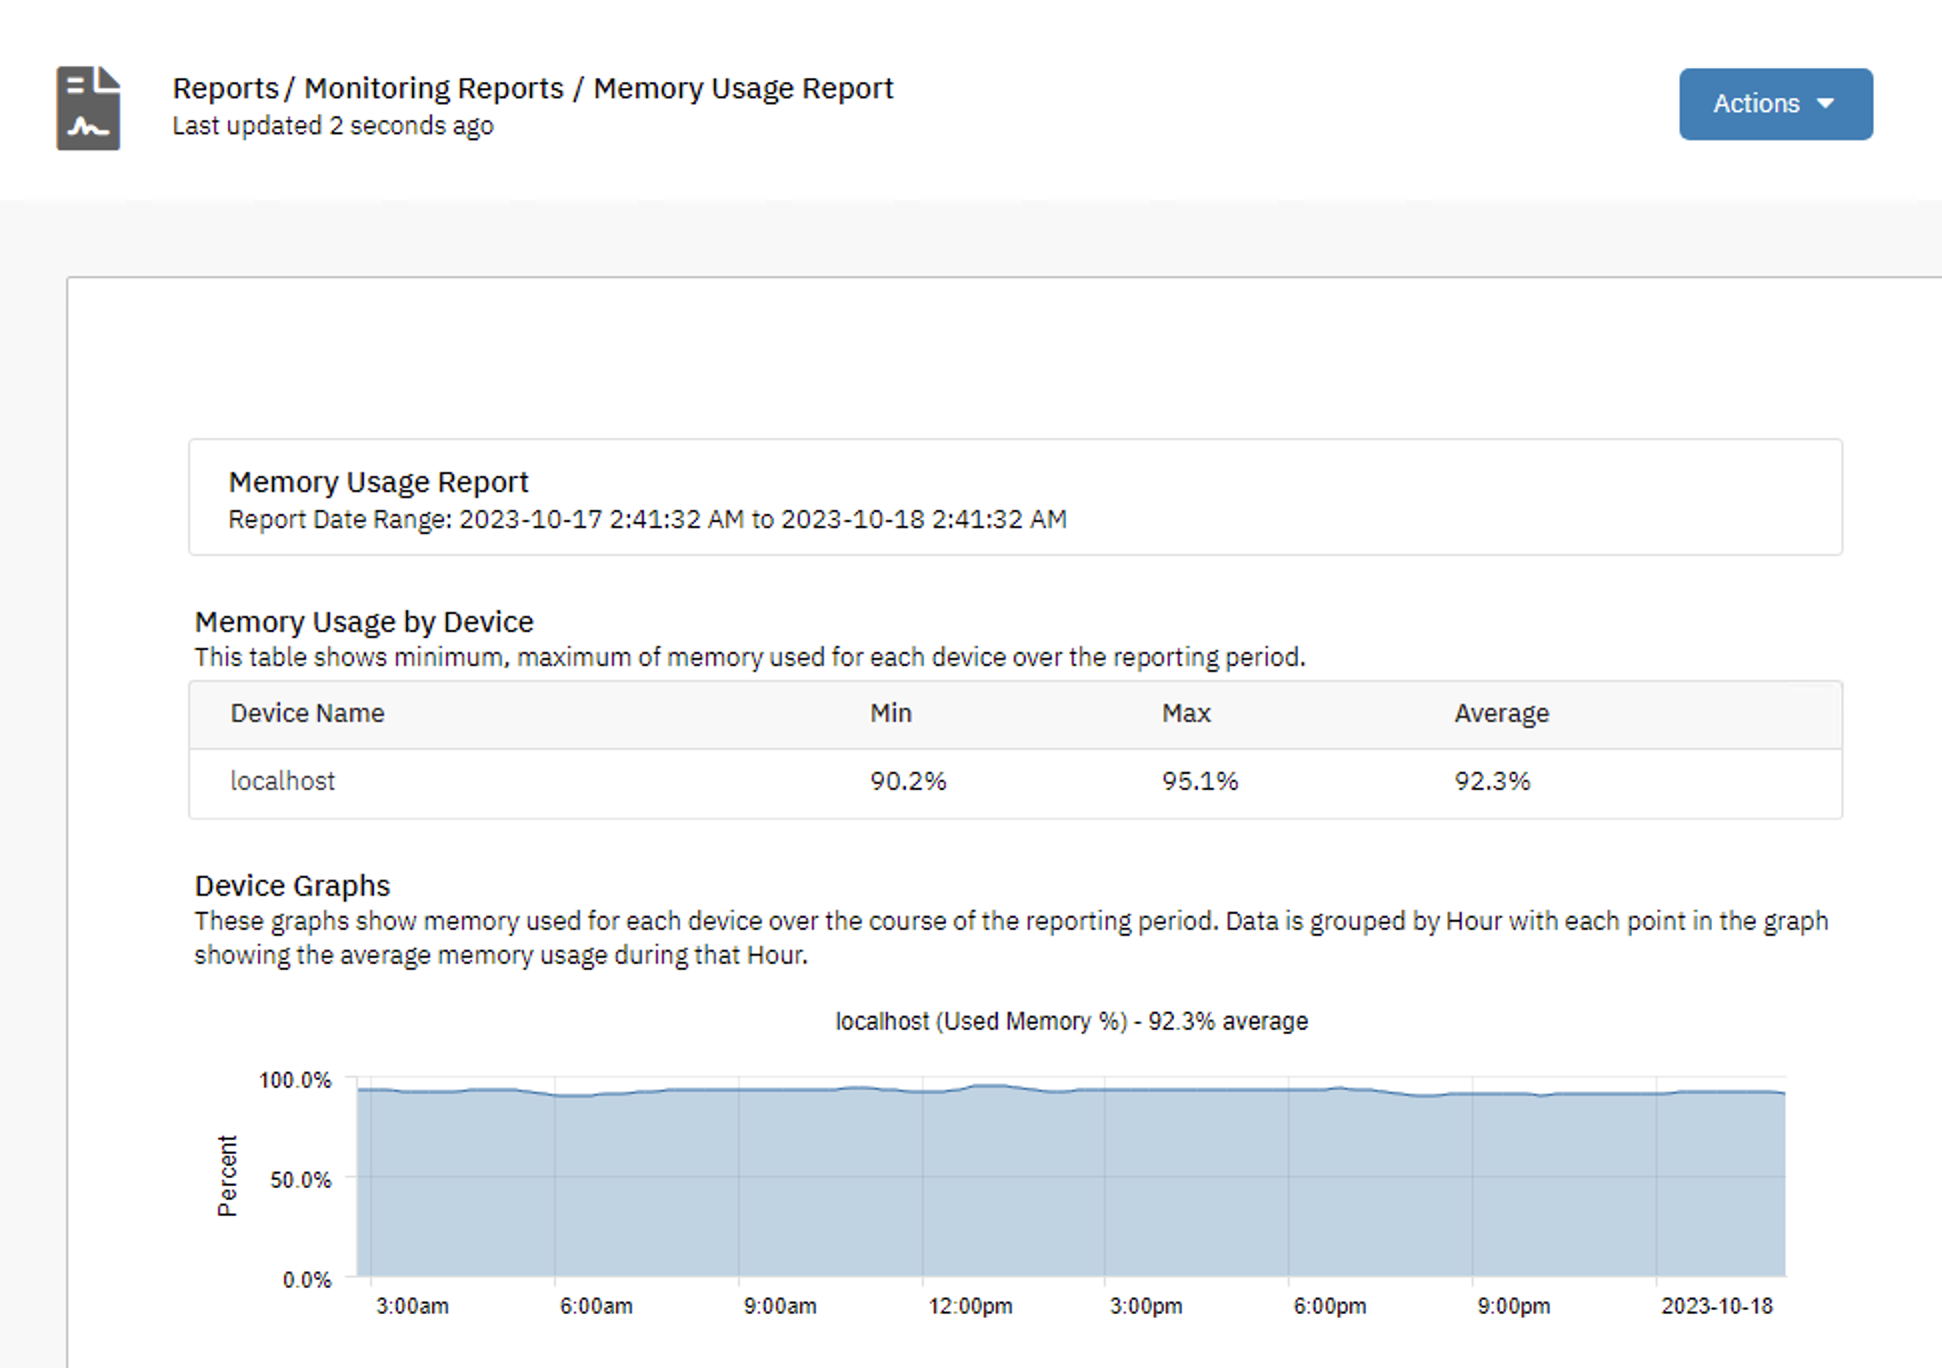
As you can see, the Memory Usage report type contains a breakdown of minimum, maximum, and average memory usage in percentage for each network device in your configuration. You also get one graph per device that conveys average memory usage per hour. Using the Actions menu, you can easily export any report as a PDF.

Please take the time to explore our other monitoring reports on other system health metrics. These reports can save you time summarizing a wealth of information from your most critical network devices, all in one place.
Inventory Reports
The other folder of default report templates covers inventory monitoring. To create informational inventory reports about your network devices, you'll need to create inventory event monitors first. FrameFlow offers three different types of inventory event monitors: the Windows Inventory Event Monitor, Linux Inventory Event Monitor, and the SNMP Inventory Event Monitor.
Creating an Inventory Report
In our example, we'll create a Windows Inventory Event Monitor, but the setup steps for all three inventory monitors are the same. Feel free to follow along with the inventory monitor that will be most helpful to you.
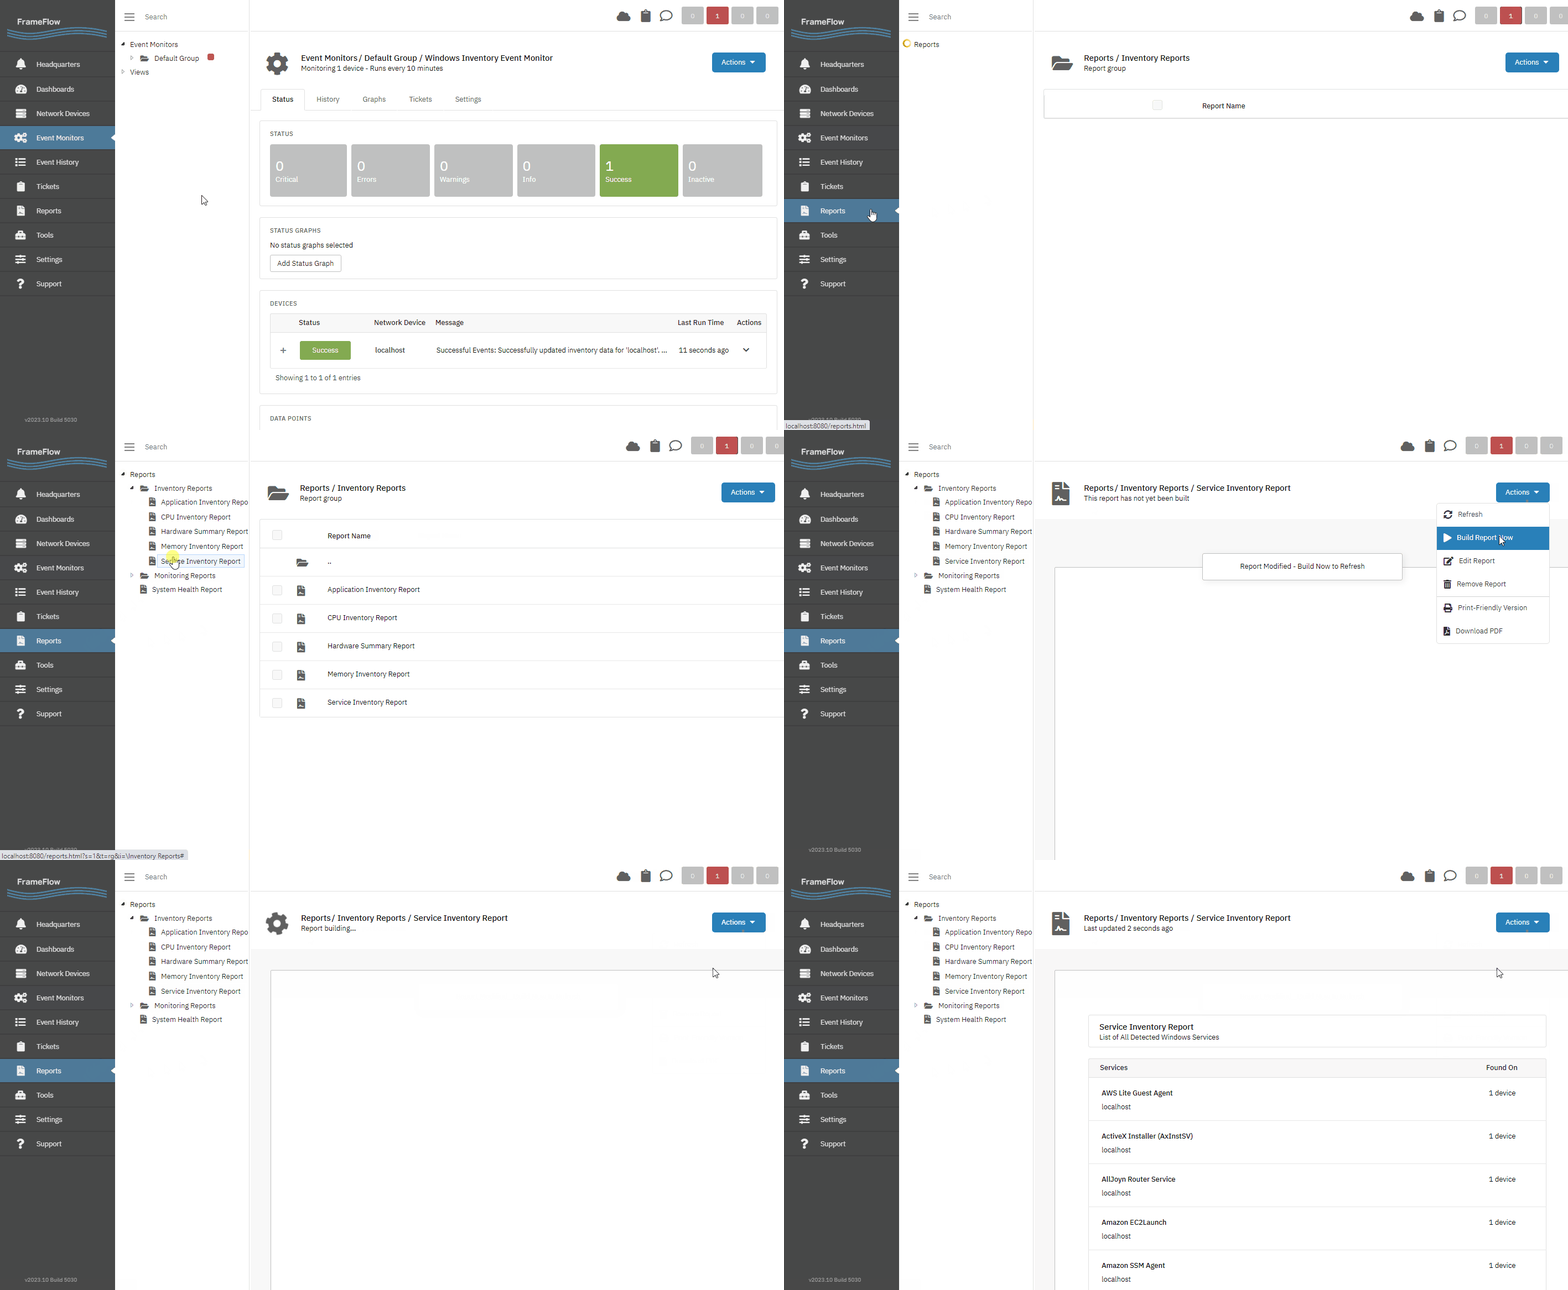
To begin, go to FrameFlow's Event Monitors section and right-click to add a new monitor as usual. Search for the Windows Inventory Event Monitor and select it from the list. Assign the network devices you want to create inventory reports about. Inventory event monitors don't have a lot of options inside their settings, but you can choose not to be alerted if the event monitor cannot establish contact. Once you've added the network devices you want to create inventory reports about, you can save and run the event monitor.

Now, navigate to Reports and select the inventory report you want to build. For example purposes, we'll create a Service Inventory Report, which will find and list all services running on the Windows devices we added to the Windows Inventory Event Monitor. When you've found the report template you want to build, use the blue Actions menu to build the report.

As with our monitoring reports, we encourage you to explore the whole list of inventory reports and set up inventory monitors for Linux and SNMP as well.
Custom Reports and Further Reading
As mentioned on Day 7 when we created a System Health Report, you can create custom reports by right-clicking on the tree structure and selecting "New Report". You can even email reports to your IT staff automatically as they're generated! To learn more about custom reports, please read our Reports tutorial.
| Day 13: Event History | Day 15: Network Monitoring |
Table of Contents
Back to Menu
Day 1: Intro and Installation
Day 2: FrameFlow's Interface
Day 3: Network Devices
Day 4: Your First Event Monitors
Day 5: Authentication Profiles
Day 6: Security
Day 7: System Health Event Monitor
Day 8: Event Monitors by Category
Day 9: Headquarters
Day 10: Dashboards
Day 11: Alert Types
Day 12: PowerShell Scripting
Day 13: Event History
Day 14: Reports and Inventory Monitoring
Day 15: Network Monitoring
Day 16: Cloud Service Monitoring
Day 17: Cloud Cost Monitoring
Day 18: Activity Monitoring
Day 19: Maintenance Windows
Day 20: Dependencies
Day 21: VMware Monitoring
Day 22: Benefits of Organization
Day 23: Assigning Device Types
Day 24: Security Best Practices
Day 25: Database Monitoring
Day 26: Hardware Monitoring
Day 27: Installation Health Event Monitor
Day 28: Multi-Site and Remote Nodes
Day 29: Failover Monitoring
Day 30: More FrameFlow Resources