Day 13: Event History
30 Days of FrameFlow
About Event History
Event History is a hub for all past monitoring results that you can access using the gray sidebar on the left of FrameFlow's interface. Upon visiting this section, you'll see the list of monitoring events from all network devices and event monitors. You can use information from the Event History to search for error events, track patterns over time, and sort through the thousands of alerts and checks that a large organization tends to rack up in a short amount of time.
Sorting Events
On the left-hand side of the Event History, you have several options that help you parse through a large number of events more conveniently. You can use these options to sort by specific statuses, non-success states, or even search for specific events using keywords. These and more sorting options are also available in the dropdown menu shown below.

Using the blue Actions menu, you can select and remove events, refresh the Event History, or export the Event History as a PDF. Below these options, you can sort by event monitor or device name and choose the number of recent events that will be shown on one page.
Click on a recent event to expand it and view more details. You can use the Actions menu to the right of each event to create a ticket related to the event. Learn more about creating tickets using our tutorial on tickets.

Searching Events
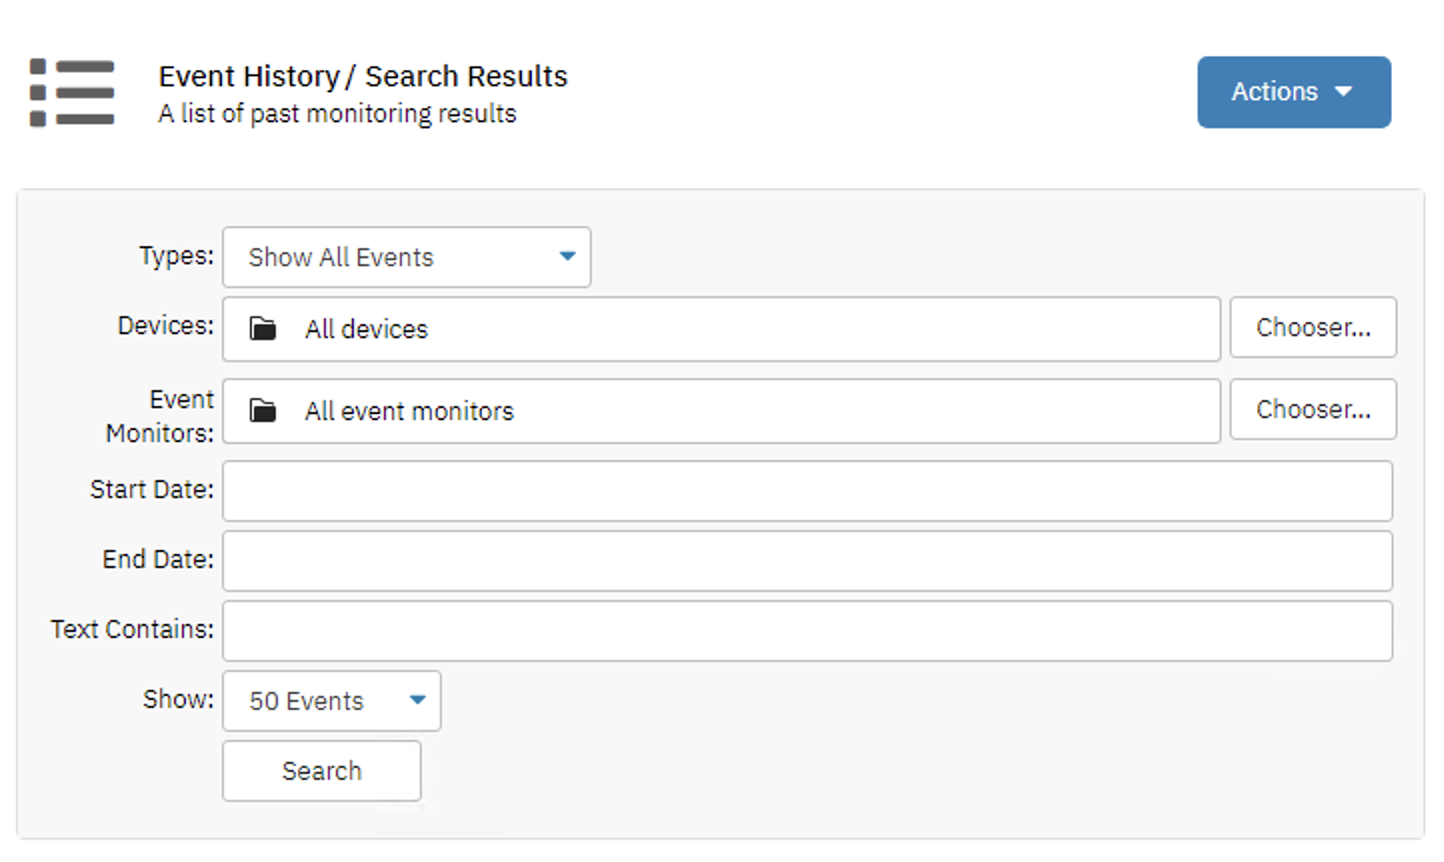
To search events, click on the "Search for Events" item below the tree structure. This will open a tool that lets you search through past monitoring results. You can filter based on network device, event monitor, date, and even search for specific text strings.

Summary
Now that you know all about FrameFlow's Event History, you can begin using it to sort and search through past monitoring results to find past and current issues and determine patterns about your network devices. Tomorrow, we'll cover the Reports section. Don't miss out!
| Day 12: PowerShell Scripting | Day 14: Reports |
Table of Contents
Back to Menu
Day 1: Intro and Installation
Day 2: FrameFlow's Interface
Day 3: Network Devices
Day 4: Your First Event Monitors
Day 5: Authentication Profiles
Day 6: Security
Day 7: System Health Event Monitor
Day 8: Event Monitors by Category
Day 9: Headquarters
Day 10: Dashboards
Day 11: Alert Types
Day 12: PowerShell Scripting
Day 13: Event History
Day 14: Reports and Inventory Monitoring
Day 15: Network Monitoring
Day 16: Cloud Service Monitoring
Day 17: Cloud Cost Monitoring
Day 18: Activity Monitoring
Day 19: Maintenance Windows
Day 20: Dependencies
Day 21: VMware Monitoring
Day 22: Benefits of Organization
Day 23: Assigning Device Types
Day 24: Security Best Practices
Day 25: Database Monitoring
Day 26: Hardware Monitoring
Day 27: Installation Health Event Monitor
Day 28: Multi-Site and Remote Nodes
Day 29: Failover Monitoring
Day 30: More FrameFlow Resources