Day 12: Extending FrameFlow Monitoring With PowerShell Scripting
30 Days of FrameFlow
Extending FrameFlow's Monitoring Capabilities
What if you have a system that you need to monitor that falls outside the scope of regular monitoring? Most every organization has complex or niche monitoring requirements, whether it’s a custom in-house system or a legacy system that’s necessary for operations. It’s important to monitor these systems but standardized options probably don’t exist for them.
FrameFlow's PowerShell Event Monitor lets you write custom monitoring actions using Windows PowerShell and integrate them fully into our monitoring and notification engine. A sample script is provided to help you get started. With just a bit of PowerShell knowledge, you can create a script that fully integrates those niche monitoring needs.

To help you develop your script, the event monitor includes a full code editor with syntax highlighting specifically designed for PowerShell scripting. The sample script you'll see upon creating a new PowerShell Event Monitor will trigger a randomized alert each time it runs.
PowerShell Library
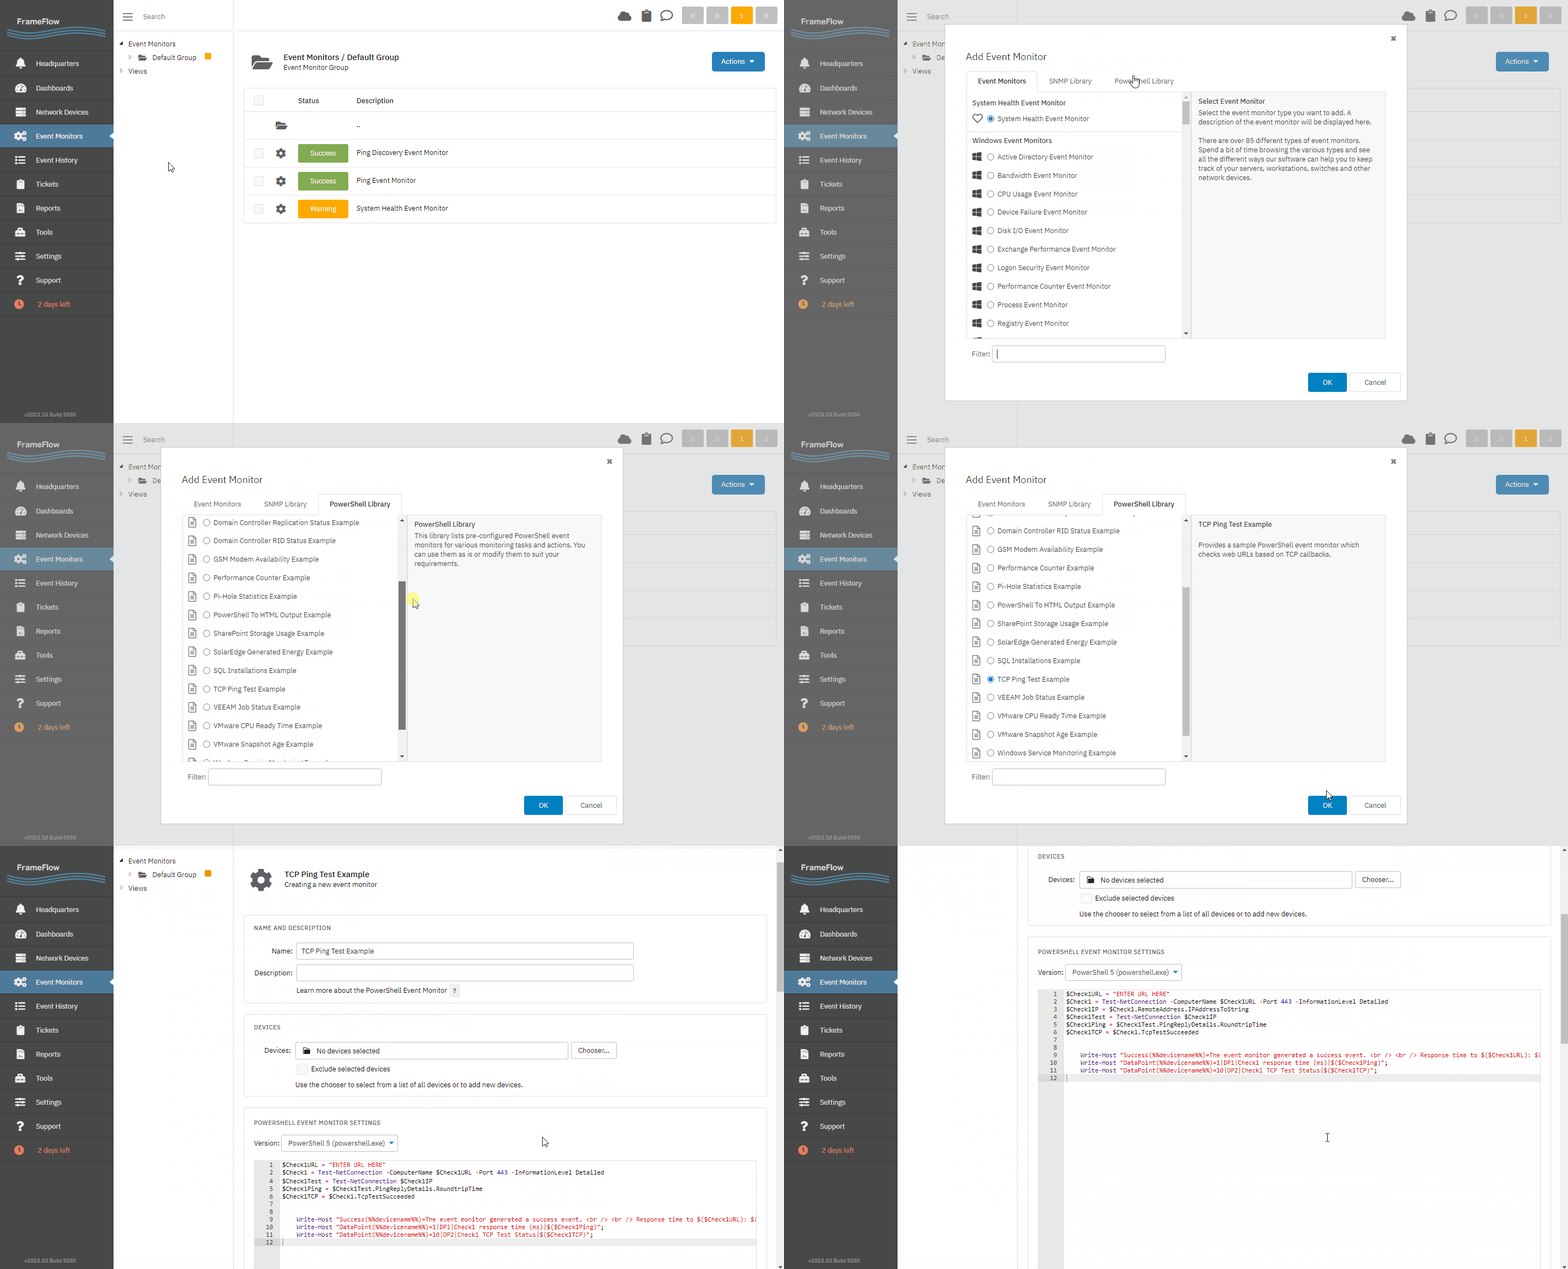
More script examples are available in our PowerShell Library. To access the library, right-click to add a new event monitor as usual, but choose the tab called "PowerShell Library" from the "Add Event Monitor" chooser, as shown in the GIF below.

In the example GIF, we chose the TCP Ping PowerShell Event Monitor, which checks web URLs based on TCP callbacks. You can use this script as-is or modify it for your own monitoring purposes.

There are over a dozen other templates available with sample code that cover some example niche monitoring scenarios. Feel free to explore them and adapt the code from any of the templates to use for your own scripts!
Summary
To learn more about script execution, output, and more, please read our tutorial on the PowerShell Event Monitor. From there, you can learn about creating custom data points from the information gathered by your PowerShell monitors and integrate them into parts of FrameFlow's interface like Dashboards and the Event History.
| Day 11: Alert Types | Day 13: Event History |
Table of Contents
Back to Menu
Day 1: Intro and Installation
Day 2: FrameFlow's Interface
Day 3: Network Devices
Day 4: Your First Event Monitors
Day 5: Authentication Profiles
Day 6: Security
Day 7: System Health Event Monitor
Day 8: Event Monitors by Category
Day 9: Headquarters
Day 10: Dashboards
Day 11: Alert Types
Day 12: PowerShell Scripting
Day 13: Event History
Day 14: Reports and Inventory Monitoring
Day 15: Network Monitoring
Day 16: Cloud Service Monitoring
Day 17: Cloud Cost Monitoring
Day 18: Activity Monitoring
Day 19: Maintenance Windows
Day 20: Dependencies
Day 21: VMware Monitoring
Day 22: Benefits of Organization
Day 23: Assigning Device Types
Day 24: Security Best Practices
Day 25: Database Monitoring
Day 26: Hardware Monitoring
Day 27: Installation Health Event Monitor
Day 28: Multi-Site and Remote Nodes
Day 29: Failover Monitoring
Day 30: More FrameFlow Resources